Home
Department Of Physics text logo
  • Research
    • Our research
    • Our research groups
    • Our research in action
    • Research funding support
    • Summer internships for undergraduates
  • Study
    • Undergraduates
    • Postgraduates
  • Engage
    • For young people
    • For teachers
    • For the public
    • For alumni
    • For business
  • Support
Menu
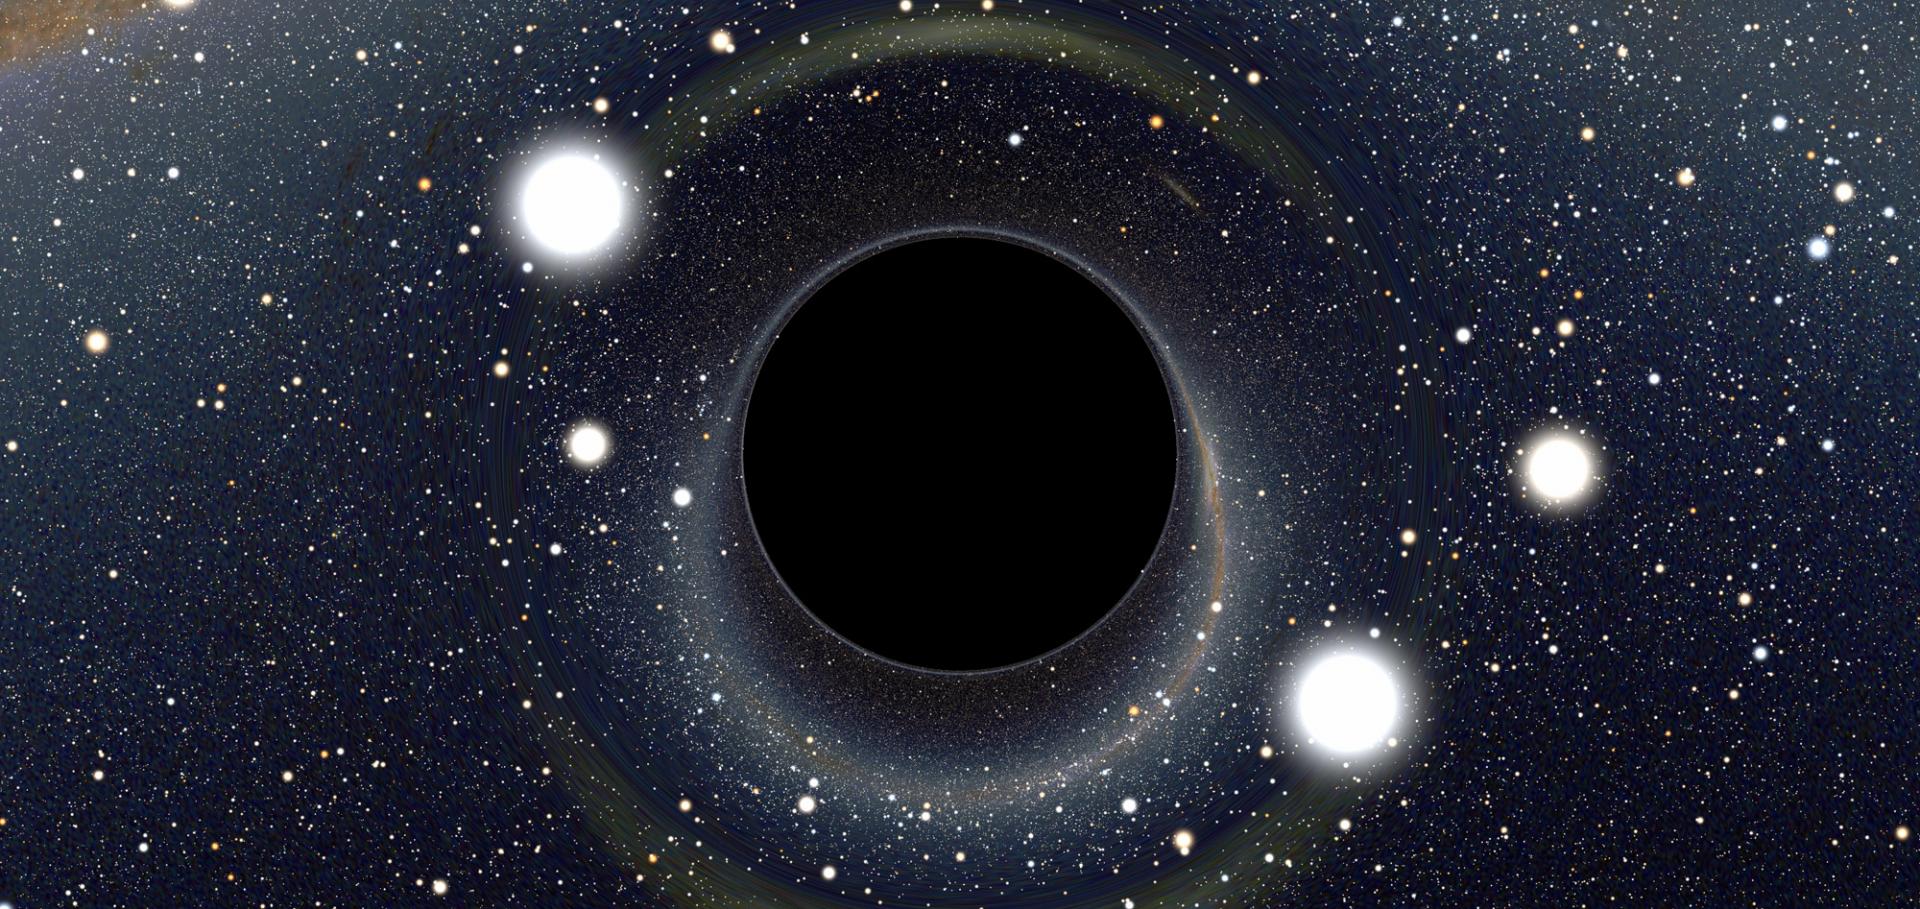
Black Hole

Lensing of space time around a black hole. At Oxford we study black holes observationally and theoretically on all size and time scales - it is some of our core work.

Credit: ALAIN RIAZUELO, IAP/UPMC/CNRS. CLICK HERE TO VIEW MORE IMAGES.

Dr Gareth Dorrian

Postdoctoral Research Assistant

Research theme

  • Astronomy and astrophysics

Sub department

  • Astrophysics

Research groups

  • Breakthrough Listen
gareth.dorrian@physics.ox.ac.uk
Denys Wilkinson Building, room 460
  • About
  • Publications

Observations of High Definition Symmetric Quasi‐Periodic Scintillations in the Mid‐Latitude Ionosphere With LOFAR

Journal of Geophysical Research: Space Physics American Geophysical Union (AGU) 129:7 (2024) e2023JA032336

Authors:

H Trigg, G Dorrian, B Boyde, A Wood, RA Fallows, M Mevius

Abstract:

AbstractWe present broadband ionospheric scintillation observations of highly defined symmetric quasi‐periodic scintillations (QPS: Maruyama, 1991, https://doi.org/10.1029/91rs00357) caused by plasma structures in the mid‐latitude ionosphere using the LOw Frequency ARray (LOFAR: van Haarlem et al., 2013, https://doi.org/10.1051/0004‐6361/201220873). Two case studies are shown, one from 15 December 2016, and one from 30 January 2018, in which well‐defined main signal fades are observed to be bounded by secondary diffraction fringing. The ionospheric plasma structures effectively behave as a Fresnel obstacle, in which steep plasma gradients at the periphery result in a series of decreasing intensity interference fringes, while the center of the structures largely block the incoming radio signal altogether. In particular, the broadband observing capabilities of LOFAR permit us to see considerable frequency dependent behavior in the QPSs which, to our knowledge, is a new result. We extract some of the clearest examples of scintillation arcs reported in an ionospheric context, from delay‐Doppler spectral analysis of these two events. These arcs permit the extraction of propagation velocities for the plasma structures causing the QPSs ranging from 50 to 00 m s−1, depending on the assumed altitude. The spacing between the individual plasma structures ranges between 5 and 20 km. The periodicities of the main signal fades in each event and, in the case of the 2018 data, co‐temporal ionosonde data, suggest the propagation of the plasma structures causing the QPSs are in the E‐region. Each of the two events is accurately reproduced using a thin screen phase model. Individual signal fades and enhancements were modeled using small variations in total electron content (TEC) amplitudes of order 1 mTECu, demonstrating the sensitivity of LOFAR to very small fluctuations in ionospheric plasma density. To our knowledge these results are among the most detailed observations and modeling of QPSs in the literature.
More details from the publisher
More details

Wavelet Analysis of Differential TEC Measurements Obtained Using LOFAR

Radio Science American Geophysical Union (AGU) 59:4 (2024) e2023RS007871

Authors:

Ben Boyde, Alan Wood, Gareth Dorrian, Frits Sweijen, Francesco de Gasperin, Maaijke Mevius, Kasia Beser, David Themens

Abstract:

Abstract Radio interferometers used to make astronomical observations, such as the LOw Frequency ARray (LOFAR), experience distortions imposed upon the received signal due to the ionosphere as well as those from instrumental errors. Calibration using a well‐characterized radio source can be used to mitigate these effects and produce more accurate images of astronomical sources, and the calibration process provides measurements of ionospheric conditions over a wide range of length scales. The basic ionospheric measurement this provides is differential Total Electron Content (TEC, the integral of electron density along the line of sight). Differential TEC measurements made using LOFAR have a precision of <1 mTECu and therefore enable investigation of ionospheric disturbances which may be undetectable to many other methods. We demonstrate an approach to identify ionospheric waves from these data using a wavelet transform and a simple plane wave model. The noise spectra are robustly characterized to provide uncertainty estimates for the fitted parameters. An example is shown in which this method identifies a wave with an amplitude an order of magnitude below those reported using Global Navigation Systems Satellite TEC measurements. Artificially generated data are used to test the accuracy of the method and establish the range of wavelengths which can be detected using this method with LOFAR data. This technique will enable the use of a large and mostly unexplored data set to study traveling ionospheric disturbances over Europe.
More details from the publisher
More details

LOFAR observations of asymmetric quasi-periodic scintillations in the mid-latitude ionosphere.

(2024)

Authors:

Gareth Dorrian, David R Themens, Toralf Renkwitz, Grzegorz Nykiel, Alan George Wood, Ben Boyde, Richard Andrew Fallows, Maaijke Mevius, Hannah Trigg
More details from the publisher

Quasi-stationary substructure within a sporadic E layer observed by the Low-Frequency Array (LOFAR)

Journal of Space Weather and Space Climate EDP Sciences 14 (2024) 27-27

Authors:

Alan G Wood, Gareth D Dorrian, Ben Boyde, Richard A Fallows, David R Themens, Maaijke Mevius, Tim Sprenger, Robert Main, S Eleri Pryse, Sean Elvidge

Abstract:

Observations made with the Low-Frequency Array (LOFAR) have been used to infer the presence of variations in a sporadic E layer on a spatial scale of several kilometres and a temporal scale of ~10 min. LOFAR stations across the Netherlands observed Cygnus A between 17 UT and 18 UT on 14th July 2018 at frequencies between 24.9 MHz and 64.0 MHz. Variations in the relative signal intensity, together with the consideration of geometric optics, were used to infer the presence of a plasma structure. Spatial variations between the stations and the dispersive nature of the observations suggested that this plasma structure was located within the ionosphere. Independent confirmation of the presence of a sporadic E layer, and variation within it, was obtained from observations made by the Juliusruh ionosonde (54.6°N, 13.4°E), which observed reflection of radio waves at an altitude of ~120 km and from frequencies of up to ~6 MHz. The large number (38) of LOFAR stations across the Netherlands, together with the sub-second temporal resolution and broadband frequency coverage of the observations, enabled the fine details of the spatial variation and the evolution of the structure to be determined. The structure was quasi-stationary, moving at ~12 m s−1, and it exhibited significant variation on spatial scales of a few kilometres. The observations were consistent with the steepening of a plasma density gradient at the edge of the feature over time due to an instability process. A 1-D numerical model showed that the observations were consistent with an electron density enhancement in the sporadic E layer with a density change of 2 × 1011 m−3 and a spatial scale of several kilometres. Collectively, these results show the ability of LOFAR to observe substructure within sporadic E layers and how this substructure varies with time. They also show the potential value of such datasets to constrain models of instability processes, or to discriminate between competing models.
More details from the publisher
More details

Statistical models of the variability of plasma in the topside ionosphere: 1. Development and optimisation

Journal of Space Weather and Space Climate EDP Sciences 14 (2024) 7-7

Authors:

Alan G Wood, Elizabeth E Donegan-Lawley, Lasse BN Clausen, Luca Spogli, Jaroslav Urbář, Yaqi Jin, Golnaz Shahtahmassebi, Lucilla Alfonsi, James T Rawlings, Antonio Cicone, Daria Kotova, Claudio Cesaroni, Per Høeg, Gareth D Dorrian, Luke D Nugent, Sean Elvidge, David R Themens, María José Brazal Aragón, Pawel Wojtkiewicz, Wojciech J Miloch

Abstract:

This work presents statistical models of the variability of plasma in the topside ionosphere based on observations made by the European Space Agency’s (ESA) Swarm satellites. The models were developed in the “Swarm Variability of Ionospheric Plasma” (Swarm-VIP) project within the European Space Agency’s Swarm+4D-Ionosphere framework. The configuration of the Swarm satellites, their near-polar orbits and the data products developed, enable studies of the spatial variability of the ionosphere at multiple scale sizes. The statistical modelling technique of Generalised Linear Modelling (GLM) was used to create models of both the electron density and measures of the variability of the plasma structures at horizontal spatial scales between 20 km and 100 km. Despite being developed using the Swarm data, the models provide predictions that are independent of these data. Separate models were created for low, middle, auroral and polar latitudes. The models make predictions based on heliogeophysical variables, which act as proxies for the solar and geomagnetic processes. The first and most significant term in the majority of the models was a proxy for solar activity. The most common second term varied with the latitudinal region. This was the Solar Zenith Angle (SZA) in the polar region, a measure of latitude in the auroral region, solar time in the mid-latitude region and a measure of latitude in the equatorial region. Other, less significant terms in the models covered a range of proxies for the solar wind, geomagnetic activity and location. In this paper, the formulation, optimisation and evaluation of these models are discussed. The models show very little bias, with a mean error of zero to two decimal places in 14 out of 20 cases. The models capture some, but not all, of the trends present in the data, with Pearson correlation coefficients of up to 0.75 between the observations and the model predictions. The models also capture some, but not all, of the variability of the ionospheric plasma, as indicated by the precision, which ranged between 0.20 and 0.83. The addition of the thermospheric density as an explanatory variable in the models improved the precision in the polar and auroral regions. It is suggested that, if the thermosphere could be observed at a higher spatial resolution, then even more of the variability of the plasma structures could be captured by statistical models. The formulation and optimisation of the models are presented in this paper. The capability of the model in reproducing the expected climatological features of the topside ionosphere, in supporting GNSS-based ionospheric observations and the performance of the model against the Thermosphere-Ionosphere-Electrodynamics General Circulation Model (TIE-GCM), are provided in a companion paper (Spogli L et al. 2024. J Space Weather Space Clim https://doi.org/10.1051/swsc/2024003).
More details from the publisher
More details

Pagination

  • First page First
  • Previous page Prev
  • Page 1
  • Page 2
  • Current page 3
  • Page 4
  • Page 5
  • Page 6
  • Page 7
  • Page 8
  • Page 9
  • Next page Next
  • Last page Last

Footer Menu

  • Contact us
  • Giving to the Dept of Physics
  • Work with us
  • Media

User account menu

  • Log in

Follow us

FIND US

Clarendon Laboratory,

Parks Road,

Oxford,

OX1 3PU

CONTACT US

Tel: +44(0)1865272200

University of Oxfrod logo Department Of Physics text logo
IOP Juno Champion logo Athena Swan Silver Award logo

© University of Oxford - Department of Physics

Cookies | Privacy policy | Accessibility statement

Built by: Versantus

  • Home
  • Research
  • Study
  • Engage
  • Our people
  • News & Comment
  • Events
  • Our facilities & services
  • About us
  • Giving to Physics
  • Current students
  • Staff intranet