

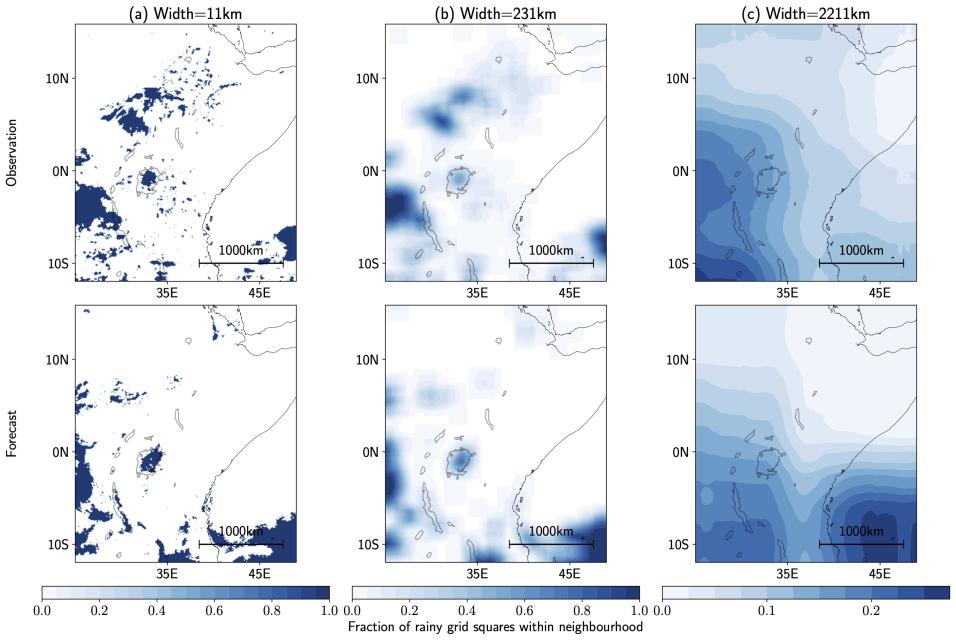
An example of applying neighbourhood aggregation to observations (top row) and forecasts (bottom row). Both forecasts and observations have been converted to binary data by applying a rainfall threshold (90th percentile). The width of the neighbourhood aggregation applied to the binary data increases from left to right. CC BY 4.0.
Verification scores are commonly used as high-level summaries of weather forecast performance, and are used routinely in operational settings, so it is important that they reward the right things. A well-known phenomenon is the “double-penalty” problem: a forecast that produces a realistic rain shower in slightly the wrong place is penalised twice, once for rain that did not fall there and once for missing the rain that did. As a result, blurry featureless forecasts can be given higher scores than more realistic looking ones. We typically want forecasts to have realistic spatial structure even if that means not getting (often very unpredictable) rain objects in exactly the right place, so this kind of scoring can be undesirable.
“Neighbourhood” scores tackle this problem by aggregating forecasts and observations in the neighbourhood of each point before calculating a score. In a new paper in Monthly Weather Review, two of these scores are examined theoretically: the fractions skill score (FSS), whch is perhaps the most widely used neighbourhood score, and the Brier divergence skill score (BDnSS). Each score is rewritten in terms of three ingredients: the error in how often the event is forecast, the error in how variable the forecast is (which reflects spatial realism and blurriness), and the correlation between forecast and observations. The paper then poses the question: can a score be increased by making one of these errors worse?
For the FSS and event frequency, the answer is yes. The FSS can give higher scores to a forecast that predicts rain too often, particularly when the forecast is only weakly correlated with observations and for intermediate neighbourhood sizes. The BDnSS does not have this problem. This gives a firmer theoretical basis for previous advice to use the FSS with percentile thresholds to remove frequency biases. Where percentile thresholds are not suitable, such as for truly binary events, the BDnSS is a more suitable neighbourhood score.
Both scores also reward forecasts that are smoother than reality, so neither fully escapes the double-penalty problem. However, the effect is weaker for the FSS, especially for small neighbourhoods and when the correlation between forecast and observations is positive but low.
The paper also points to scores used outside of weather forecasting, such as the structural similarity index, that do not show these weaknesses under the same framework and deserve further study for weather verification.
For more details, please see the full paper: Investigating how the fractions skill score and Brier divergence skill score reflect forecast error. Monthly Weather Review, 154, 2555–2565, https://doi.org/10.1175/MWR-D-26-0095.1
This work is part of the EERIE project, funded by the European Union (Grant Agreement 101081383) and by UK Research and Innovation under the UK government’s Horizon Europe funding guarantee (Grant 10049639).