Home
Department Of Physics text logo
  • Research
    • Our research
    • Our research groups
    • Our research in action
    • Research funding support
    • Summer internships for undergraduates
  • Study
    • Undergraduates
    • Postgraduates
  • Engage
    • For alumni
    • For business
    • For schools
    • For the public
Menu
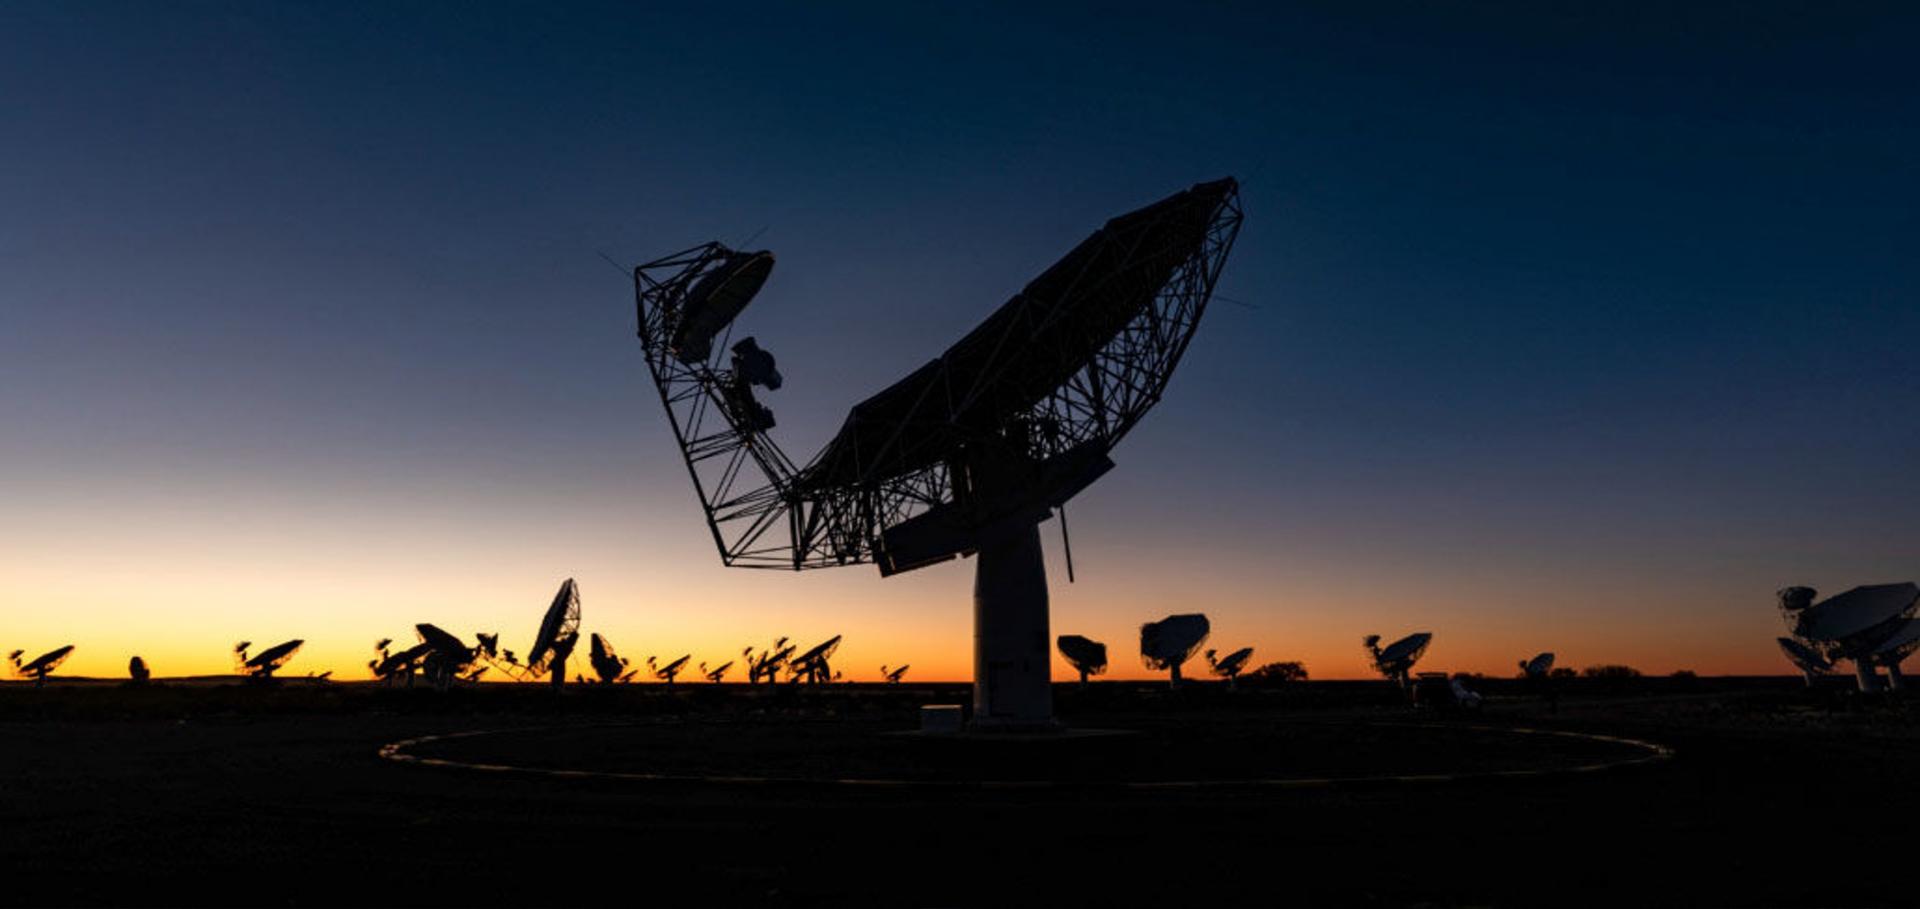
MeerKAT radio telescope
Credit: SARAO

Dr Anastasia Ponomareva

Visitor

Research theme

  • Astronomy and astrophysics

Sub department

  • Astrophysics

Research groups

  • Galaxy formation and evolution
  • Hintze Centre for Astrophysical Surveys
  • MeerKAT
anastasia.ponomareva@physics.ox.ac.uk
Denys Wilkinson Building, room 558
  • About
  • Publications

MIGHTEE-H I: the first MeerKAT H I mass function from an untargeted interferometric survey

Monthly Notices of the Royal Astronomical Society Oxford University Press 522:4 (2023) 5308-5319

Authors:

Anastasia A Ponomareva, Matt J Jarvis, Hengxing Pan, Natasha Maddox, Michael G Jones, Bradley S Frank, Sambatriniaina HA Rajohnson, Wanga Mulaudzi, Martin Meyer, Elizabeth AK Adams, Maarten Baes, Kelley M Hess, Sushma Kurapati, Isabella Prandoni, Francesco Sinigaglia, Kristine Spekkens, Madalina Tudorache, Ian Heywood, Jordan D Collier, Srikrishna Sekhar

Abstract:

We present the first measurement of the H I mass function (HIMF) using data from MeerKAT, based on 276 direct detections from the MeerKAT International GigaHertz Tiered Extragalactic Exploration (MIGHTEE) Survey Early Science data covering a period of approximately a billion years (0 ≤ z ≤ 0.084). This is the first HIMF measured using interferometric data over non-group or cluster field, i.e. a deep blank field. We constrain the parameters of the Schechter function that describes the HIMF with two different methods: 1/Vmax and modified maximum likelihood (MML). We find a low-mass slope α=−1.29+0.37−0.26 , ‘knee’ mass log10(M∗/M⊙)=10.07+0.24−0.24 and normalization log10(ϕ∗/Mpc−3)=−2.34+0.32−0.36 (H0 = 67.4 km s−1 Mpc−1) for 1/Vmax , and α=−1.44+0.13−0.10 , ‘knee’ mass log10(M∗/M⊙)=10.22+0.10−0.13 and normalization log10(ϕ∗/Mpc−3)=−2.52+0.19−0.14 for MML. When using 1/Vmax we find both the low-mass slope and ‘knee’ mass to be consistent within 1σ with previous studies based on single-dish surveys. The cosmological mass density of H I is found to be slightly larger than previously reported: ΩHI=5.46+0.94−0.99×10⁻⁴h−167.4 from 1/Vmax and ΩHI=6.31+0.31−0.31×10⁻⁴h−167.4 from MML but consistent within the uncertainties. We find no evidence for evolution of the HIMF over the last billion years.
More details from the publisher
Details from ORA
More details

MIGHTEE-H i: possible interactions with the galaxy NGC 895

Monthly Notices of the Royal Astronomical Society Oxford University Press 521:4 (2023) 5177-5190

Authors:

B Namumba, J Román, J Falcón-Barroso, Jh Knapen, R Ianjamasimanana, E Naluminsa, Gig Józsa, M Korsaga, N Maddox, B Frank, S Sikhosana, S Legodi, C Carignan, Aa Ponomareva, T Jarrett, D Lucero, Om Smirnov, Jm Van Der Hulst, Dj Pisano, K Malek, L Marchetti, M Vaccari, M Jarvis, M Baes, M Meyer, Eak Adams, H Chen, J Delhaize, Sha Rajohnson, S Kurapati, I Heywood, L Verdes-Montenegro

Abstract:

The transformation and evolution of a galaxy is strongly influenced by interactions with its environment. Neutral hydrogen (H i) is an excellent way to trace these interactions. Here, we present H i observations of the spiral galaxy NGC 895, which was previously thought to be isolated. High-sensitivity H i observations from the MeerKAT large survey project MIGHTEE reveal possible interaction features, such as extended spiral arms and the two newly discovered H i companions, that drive us to change the narrative that it is an isolated galaxy. We combine these observations with deep optical images from the Hyper Suprime Camera to show an absence of tidal debris between NGC 895 and its companions. We do find an excess of light in the outer parts of the companion galaxy MGTH_J022138.1-052631, which could be an indication of external perturbation and thus possible sign of interactions. Our analysis shows that NGC 895 is an actively star-forming galaxy with a SFR of 1.75 ± 0.09[M⊙/yr], a value typical for high-stellar mass galaxies on the star-forming main sequence. It is reasonable to state that different mechanisms may have contributed to the observed features in NGC 895, and this emphasizes the need to revisit the target with more detailed observations. Our work shows the high potential and synergy of using state-of-the-art data in both H i and optical to reveal a more complete picture of galaxy environments.
More details from the publisher
Details from ORA
More details
More details

First release of Apertif imaging survey data

Astronomy and Astrophysics EDP Sciences 667 (2022) A38

Authors:

Eak Adams, B Adebahr, Wjg de Blok, H Denes, Km Hess, Jm van der Hulst, A Kutkin, Dm Lucero, R Morganti, Va Moss, Ta Oosterloo, E Orru, R Schulz, As van Amesfoort, A Berger, Om Boersma, M Bouwhuis, R van den Brink, Wa van Cappellen, L Connor, Ahwm Coolen, S Damstra, Gnj van Diepen, Tj Dijkema, N Ebbendorf, Yg Grange, R de Goei, Aw Gunst, Ha Holties, B Hut, Mv Ivashina, Gig Jozsa, J van Leeuwen, Gm Loose, Y Maan, M Mancini, A Mika, H Mulder, Mj Norden, Ar Offringa, Lc Oostrum, I Pastor-Marazuela, Dj Pisano, Anastasia Ponomareva, Jw Romein, M Ruiter, Ap Schoenmakers, D van der Schuur, Jj Sluman, R Smits

Abstract:

Context. Apertif is a phased-array feed system for the Westerbork Synthesis Radio Telescope, providing forty instantaneous beams over 300 MHz of bandwidth. A dedicated survey program utilizing this upgrade started on 1 July 2019, with the last observations taken on 28 February 2022. The imaging survey component provides radio continuum, polarization, and spectral line data.
Aims. Public release of data is critical for maximizing the legacy of a survey. Toward that end, we describe the release of data products from the first year of survey operations, through 30 June 2020. In particular, we focus on defining quality control metrics for the processed data products.
Methods. The Apertif imaging pipeline, Apercal, automatically produces non-primary beam corrected continuum images, polarization images and cubes, and uncleaned spectral line and dirty beam cubes for each beam of an Apertif imaging observation. For this release, processed data products are considered on a beam-by-beam basis within an observation. We validate the continuum images by using metrics that identify deviations from Gaussian noise in the residual images. If the continuum image passes validation, we release all processed data products for a given beam. We apply further validation to the polarization and line data products and provide flags indicating the quality of those data products.
Results. We release all raw observational data from the first year of survey observations, for a total of 221 observations of 160 independent target fields, covering approximately one thousand square degrees of sky. Images and cubes are released on a per beam basis, and 3374 beams (of 7640 considered) are released. The median noise in the continuum images is 41.4 uJy beam−1, with a slightly lower median noise of 36.9 uJy beam−1 in the Stokes V polarization image. The median angular resolution is 11.6″/sin δ. The median noise for all line cubes, with a spectral resolution of 36.6 kHz, is 1.6 mJy beam−1, corresponding to a 3-σ H I column density sensitivity of 1.8 × 10²⁰ atoms cm−2 over 20 km s−1 (for a median angular resolution of 24″ × 15″). Line cubes at lower frequency have slightly higher noise values, consistent with the global RFI environment and overall Apertif system performance. We also provide primary beam images for each individual Apertif compound beam. The data are made accessible using a Virtual Observatory interface and can be queried using a variety of standard tools.
More details from the publisher
Details from ORA
More details

MIGHTEE-Hi: evolution of hi scaling relations of star-forming galaxies at z < 0.5* * released on July 29, 2022

Astrophysical Journal Letters IOP Science 935:1 (2022) L13

Authors:

F Sinigaglia, G Rodighiero, E Elson, M Vaccari, N Maddox, Bs Frank, Mj Jarvis, T Oosterloo, R Davé, M Salvato, M Baes, S Bellstedt, L Bisigello, Jd Collier, Rhw Cook, Ljm Davies, J Delhaize, Sp Driver, C Foster, S Kurapati, Cd Claudia, C Lidman, Pe Mancera Piña, Mj Meyer, Km Mogotsi, H Pan, Aa Ponomareva, I Prandoni, Sha Rajohnson, Asg Robotham, Mg Santos, S Sekhar, K Spekkens, Je Thorne, Jm van der Hulst, Oi Wong

Abstract:

We present the first measurements of H i galaxy scaling relations from a blind survey at z > 0.15. We perform spectral stacking of 9023 spectra of star-forming galaxies undetected in H i at 0.23 < z < 0.49, extracted from MIGHTEE-H i Early Science data cubes, acquired with the MeerKAT radio telescope. We stack galaxies in bins of galaxy properties (stellar mass M *, star formation rateSFR, and specific star formation rate sSFR, with sSFR ≡ M */SFR), obtaining ≳5σ detections in most cases, the strongest H i-stacking detections to date in this redshift range. With these detections, we are able to measure scaling relations in the probed redshift interval, finding evidence for a moderate evolution from the median redshift of our sample z med ∼ 0.37 to z ∼ 0. In particular, low-M * galaxies ( log 10 ( M * / M ⊙ ) ∼ 9 ) experience a strong H i depletion (∼0.5 dex in log 10 ( M H I / M ⊙ ) ), while massive galaxies ( log 10 ( M * / M ⊙ ) ∼ 11 ) keep their H i mass nearly unchanged. When looking at the star formation activity, highly star-forming galaxies evolve significantly in M H I (f H I, where f H I ≡ M H I/M *) at fixed SFR (sSFR), while at the lowest probed SFR (sSFR) the scaling relations show no evolution. These findings suggest a scenario in which low-M * galaxies have experienced a strong H i depletion during the last ∼5 Gyr, while massive galaxies have undergone a significant H i replenishment through some accretion mechanism, possibly minor mergers. Interestingly, our results are in good agreement with the predictions of the simba simulation. We conclude that this work sets novel important observational constraints on galaxy scaling relations.
More details from the publisher
Details from ORA
More details

MIGHTEE - H I. The relation between the H I gas in galaxies and the cosmic web

Monthly Notices of the Royal Astronomical Society Oxford University Press 513:2 (2022) 2168-2177

Authors:

Madalina N Tudorache, Mj Jarvis, I Heywood, Aa Ponomareva, N Maddox, Bs Frank, Nj Adams, Raa Bowler, Ih Whittam, M Baes, H Pan, Sha Rajohnson, F Sinigaglia, K Spekkens

Abstract:

We study the 3D axis of rotation (3D spin) of 77 Hi galaxies from the MIGHTEE-Hi Early Science observations, and its relation to the filaments of the cosmic web. For this Hi-selected sample, the alignment between the spin axis and the closest filament (|cos ψ|) is higher for galaxies closer to the filaments, with 〈|cos ψ|〉 = 0.66 ± 0.04 for galaxies <5 Mpc from their closest filament compared to 〈|cos ψ|〉 = 0.37 ± 0.08 for galaxies at 5 < d < 10 Mpc. We find that galaxies with a low Hi-to-stellar mass ratio (log10(MHi/M∗) < 0.11) are more aligned with their closest filaments, with 〈|cos ψ|〉 = 0.58 ± 0.04; whilst galaxies with (log10(MHi/M∗) > 0.11) tend to be mis-aligned, with 〈|cos ψ|〉 = 0.44 ± 0.04. We find tentative evidence that the spin axis of Hi-selected galaxies tend to be aligned with associated filaments (d < 10 Mpc), but this depends on the gas fractions. Galaxies that have accumulated more stellar mass compared to their gas mass tend towards stronger alignment. Our results suggest that those galaxies that have accrued high gas fraction with respect to their stellar mass may have had their spin axis alignment with the filament disrupted by a recent gas-rich merger, whereas the spin vector for those galaxies in which the neutral gas has not been strongly replenished through a recent merger tend to orientate towards alignment with the filament. We also investigate the spin transition between galaxies with a high Hi content and a low Hi content at a threshold of MHI ≈ 109.5 M⊙ found in simulations; however, we find no evidence for such a transition with the current data.
More details from the publisher
Details from ORA
More details

Pagination

  • First page First
  • Previous page Prev
  • Page 1
  • Page 2
  • Current page 3
  • Page 4
  • Page 5
  • Page 6
  • Next page Next
  • Last page Last

Footer Menu

  • Contact us
  • Giving to the Dept of Physics
  • Work with us
  • Media

User account menu

  • Log in

Follow us

FIND US

Clarendon Laboratory,

Parks Road,

Oxford,

OX1 3PU

CONTACT US

Tel: +44(0)1865272200

University of Oxfrod logo Department Of Physics text logo
IOP Juno Champion logo Athena Swan Silver Award logo

© University of Oxford - Department of Physics

Cookies | Privacy policy | Accessibility statement

Built by: Versantus

  • Home
  • Research
  • Study
  • Engage
  • Our people
  • News & Comment
  • Events
  • Our facilities & services
  • About us
  • Current students
  • Staff intranet