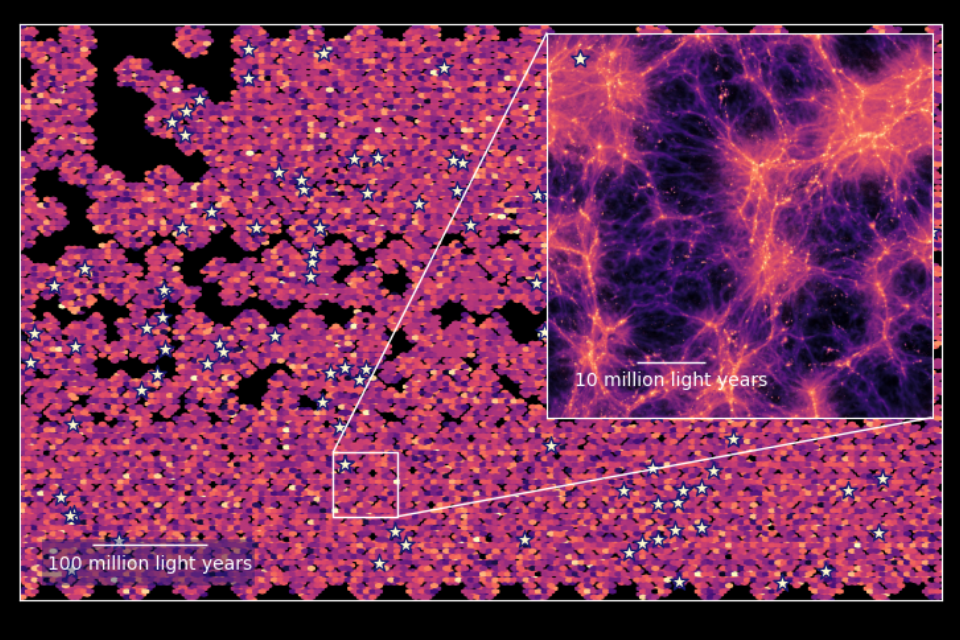
Section of the Line Intensity Map created by charting the distribution and concentration of excited hydrogen (via the Lyman alpha wavelength) in the universe ten billion years ago. The stars mark where HETDEX has found galaxies. The inset simulates the structure present in this map once it is zoomed in on and background noise is removed from the data.
An international team of astronomers have used data from the Hobby-Eberly Telescope Dark Energy Experiment (HETDEX) to make the largest, most accurate 3D map yet of the light emitted by excited hydrogen in the early universe. This map reveals previously hidden structures from 9 to 11 billion years ago.
The University of Oxford contributed to the construction of HETDEX, with Professor Gavin Dalton leading Oxford’s involvement in building the instrument that made this discovery possible.
The new 3D map focuses on Lyman-alpha light — a specific wavelength emitted by excited hydrogen atoms when energised by nearby stars. Lyman-alpha light is a great tool for finding bright galaxies in this far-off time, which experienced a rash of star creation. However, the locations of fainter galaxies and gas, which also emit Lyman-alpha, have remained largely unknown.
Using a technique called Line Intensity Mapping, the new map pulls these objects into view. Unlike conventional surveys, which identify galaxies one by one, Line Intensity Mapping analyses millions of spectra simultaneously, measuring the aggregate signal across vast swathes of sky. HETDEX has gathered more than 600 million spectra over an area equivalent to more than 2,000 full Moons, creating an unprecedented dataset.
To produce the new map, researchers processed roughly half a petabyte of data using advanced computing facilities. By correlating the known positions of bright galaxies with fainter surrounding emission, they were able to reconstruct the three-dimensional distribution of hydrogen gas and galaxies across cosmic time.
'The achievements of the HETDEX project are an excellent example of how we were able to build on the extensive capabilities and years of manufacturing experience of the physics mechanical workshop,' reflected Professor Dalton. 'We were able to both streamline the manufacturing of several thousand components and optimise the integration and performance of HETDEX’s ensemble of 150 spectrographs.'
‘Intensity mapping is a technique that is relatively new but has the potential to be a powerful probe of how galaxies trace the large-scale structure of the Universe and test whether it agrees with our current understanding of the amount of Dark Energy and Dark Matter in the Universe,’ commented Professor Matt Jarvis, one of the authors from the Department of Physics. ‘This is the first big study using the Lyman-alpha line of hydrogen and shows that such measurements are feasible. In the future it will be possible to combine this information with other ways of tracing the same structure — using other emission lines at different wavelengths and with other galaxies and quasars across all redshifts — enabling a full picture of how structure evolves over the history of the Universe.’
Lyα Intensity Mapping in HETDEX: Galaxy-Lyα Intensity Cross-power Spectrum, Niemeyer et al., The Astrophysical Journal, 3 March 2026