Home
Department Of Physics text logo
  • Research
    • Our research
    • Our research groups
    • Our research in action
    • Research funding support
    • Summer internships for undergraduates
  • Study
    • Undergraduates
    • Postgraduates
  • Engage
    • For alumni
    • For business
    • For schools
    • For the public
Menu
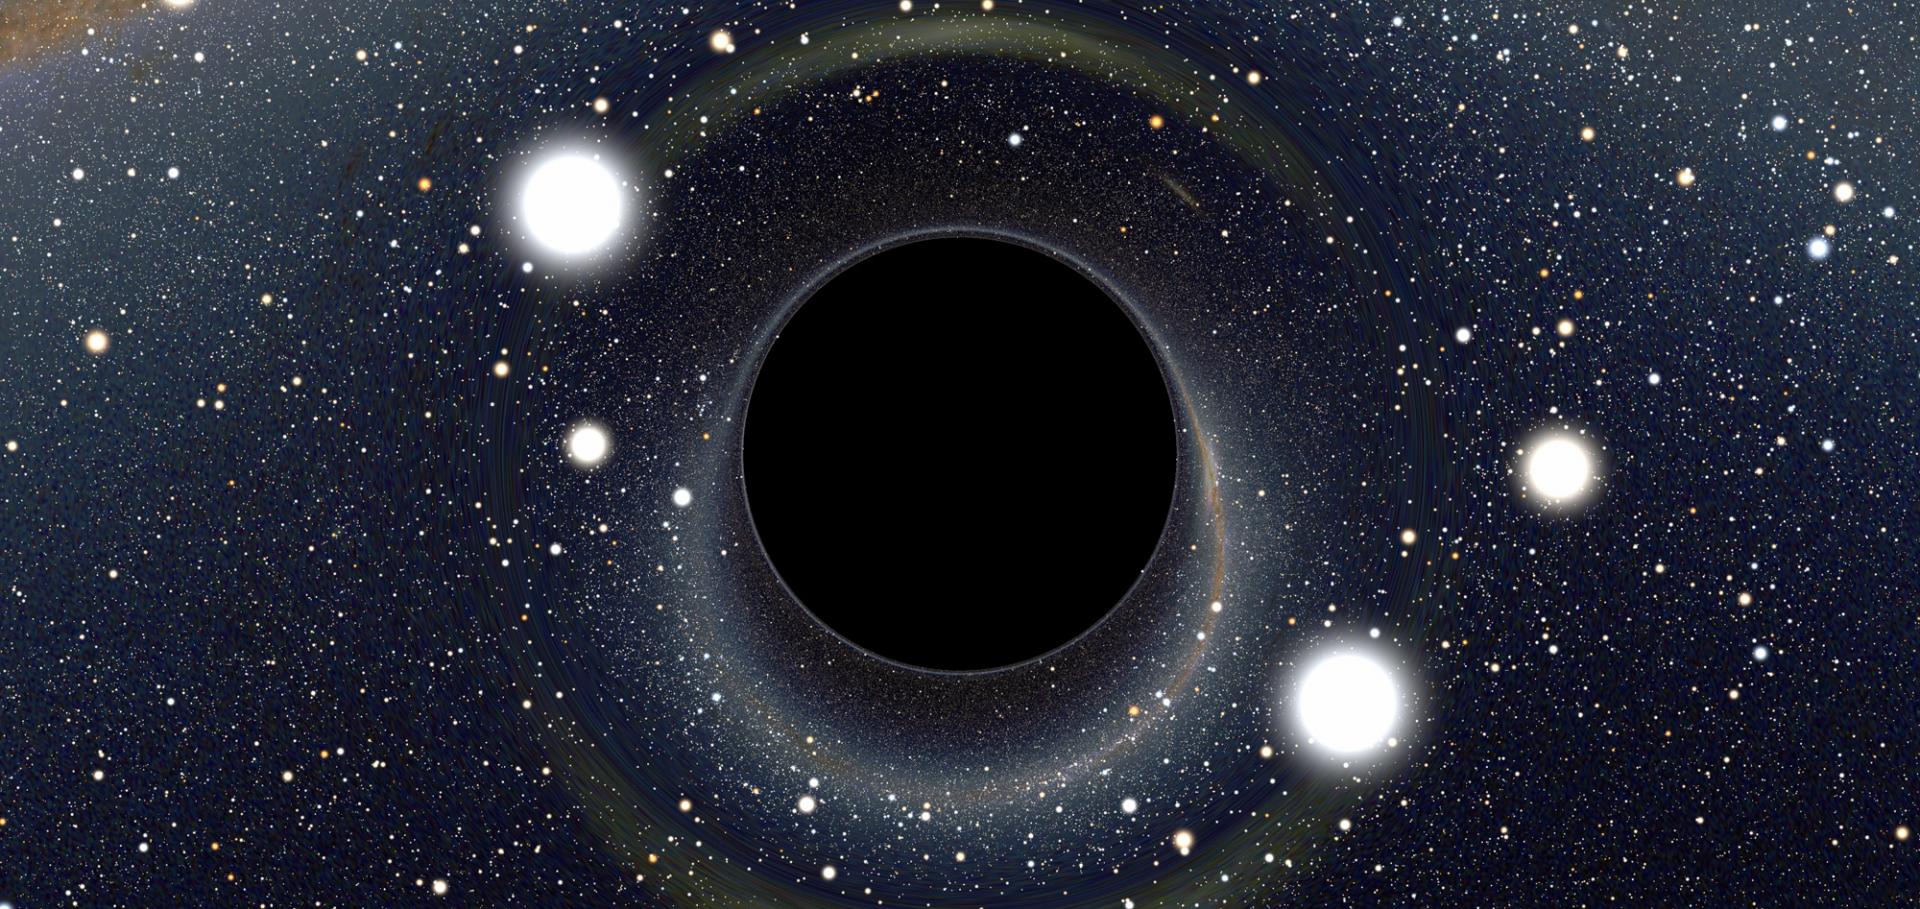
Black Hole

Lensing of space time around a black hole. At Oxford we study black holes observationally and theoretically on all size and time scales - it is some of our core work.

Credit: ALAIN RIAZUELO, IAP/UPMC/CNRS. CLICK HERE TO VIEW MORE IMAGES.

Dr Aprajita Verma

Senior Research Fellow

Research theme

  • Astronomy and astrophysics

Sub department

  • Astrophysics

Research groups

  • Zooniverse
  • Astronomical instrumentation
  • Galaxy formation and evolution
  • Rubin-LSST
  • Extremely Large Telescope
aprajita.verma@physics.ox.ac.uk
Telephone: 01865 (2)73374
Denys Wilkinson Building, room 760
  • About
  • Outreach
  • Teaching
  • Publications

The K-band Hubble diagram of submillimetre galaxies and hyperluminous galaxies

Monthly Notices of the Royal Astronomical Society 346:4 (2003)

Authors:

S Serjeant, D Farrah, J Geach, T Takagi, A Verma, A Kaviani, M Fox

Abstract:

We present the K-baad Hubble diagrams (K-z relations) of submillimetre-selected galaxies and hyperluminous galaxies (HLIRGs). We report the discovery of a remarkably tight K-z relation of HLIRGs, indistinguishable from that of the most luminous radio galaxies. Like radio galaxies, the HLIRG K-z relation at z ∼ 3 is consistent with a passively evolving ∼3L* instantaneous starburst starting from a redshift of z ∼ 10. In contrast, many submillimetre-selected galaxies are ≳2 mag fainter, and the population has a much larger dispersion. We argue that dust obscuration and/or a larger mass range may be responsible for this scatter. The galaxies so far proved to be hyperluminous may have been biased towards higher AGN bolometric contributions than submillimetre-selected galaxies due to the 60-μm selection of some, so the location on the K-z relation may be related to the presence of the most massive active galactic nucleus. Alternatively, a particular host galaxy mass range may be responsible for both extreme star formation and the most massive active nuclei.
More details from the publisher

The environments of hyperluminous infrared galaxies at 0.44

(2003)

Authors:

D Farrah, J Geach, M Fox, S Serjeant, S Oliver, A Verma, A Kaviani, M Rowan-Robinson
More details from the publisher

The K-band Hubble diagram of sub-mm galaxies and hyperluminous galaxies

(2003)

Authors:

Stephen Serjeant, Duncan Farrah, James Geach, Toshinobu Takagi, Aprajita Verma, Ali Kaviani, Matt Fox
More details from the publisher

A mid-infrared spectroscopic survey of starburst galaxies: Excitation and abundances

Astronomy & Astrophysics EDP Sciences 403:3 (2003) 829-846

Authors:

A Verma, D Lutz, E Sturm, A Sternberg, R Genzel, W Vacca
More details from the publisher
Details from ArXiV

A mir spectroscopic survey of starburst galaxies

European Space Agency, (Special Publication) ESA SP (2003) 263-266

Authors:

A Verma, D Lutz, E Sturm, A Sternberg, R Genzel

Abstract:

We present a mid-infrared (MIR) spectroscopic survey of starburst galaxies as an example of analysis of scientifically focused samples selected from the ISO Data Archive (IDA). We use fine structure lines (FSL) ratios of Ne, Ar and S to construct diagnostic excitation diagrams and, in combination with hydrogen recombination lines (HRL), we determine their elemental abundances. For Ne and Ar, we find that excitation indicators are positively correlated with each other and negatively with abundance. On comparison with a complementary sample of galactic H II regions we find that starbursts are generally of lower excitation. Starbursts exhibiting Wolf-Rayet (WR) features are separated both in excitation and abundance from the remaining starbursts. Most surprisingly, S is found to be underabundant by a factor of ∼ 3 in our low excitation starbursts with respect to the Ne and Ar, contrary to expectations from nucleosynthesis theory. Our results are combined with those of a related sub-sample of Seyfert galaxies (Sturm et al. 2002) to derive diagnostic diagrams discriminating the two types of activity on the basis of excitation traced by MIR lines. The data presented will be useful as a reference for observations of fainter and/or higher redshift sources with future IR observatories such as SIRTF, SOFIA and Herschel.

Pagination

  • First page First
  • Previous page Prev
  • …
  • Page 29
  • Page 30
  • Page 31
  • Page 32
  • Current page 33
  • Page 34
  • Page 35
  • Page 36
  • Page 37
  • …
  • Next page Next
  • Last page Last

Footer Menu

  • Contact us
  • Giving to the Dept of Physics
  • Work with us
  • Media

User account menu

  • Log in

Follow us

FIND US

Clarendon Laboratory,

Parks Road,

Oxford,

OX1 3PU

CONTACT US

Tel: +44(0)1865272200

University of Oxfrod logo Department Of Physics text logo
IOP Juno Champion logo Athena Swan Silver Award logo

© University of Oxford - Department of Physics

Cookies | Privacy policy | Accessibility statement

Built by: Versantus

  • Home
  • Research
  • Study
  • Engage
  • Our people
  • News & Comment
  • Events
  • Our facilities & services
  • About us
  • Current students
  • Staff intranet