Home
Department Of Physics text logo
  • Research
    • Our research
    • Our research groups
    • Our research in action
    • Research funding support
    • Summer internships for undergraduates
  • Study
    • Undergraduates
    • Postgraduates
  • Engage
    • For alumni
    • For business
    • For schools
    • For the public
Menu
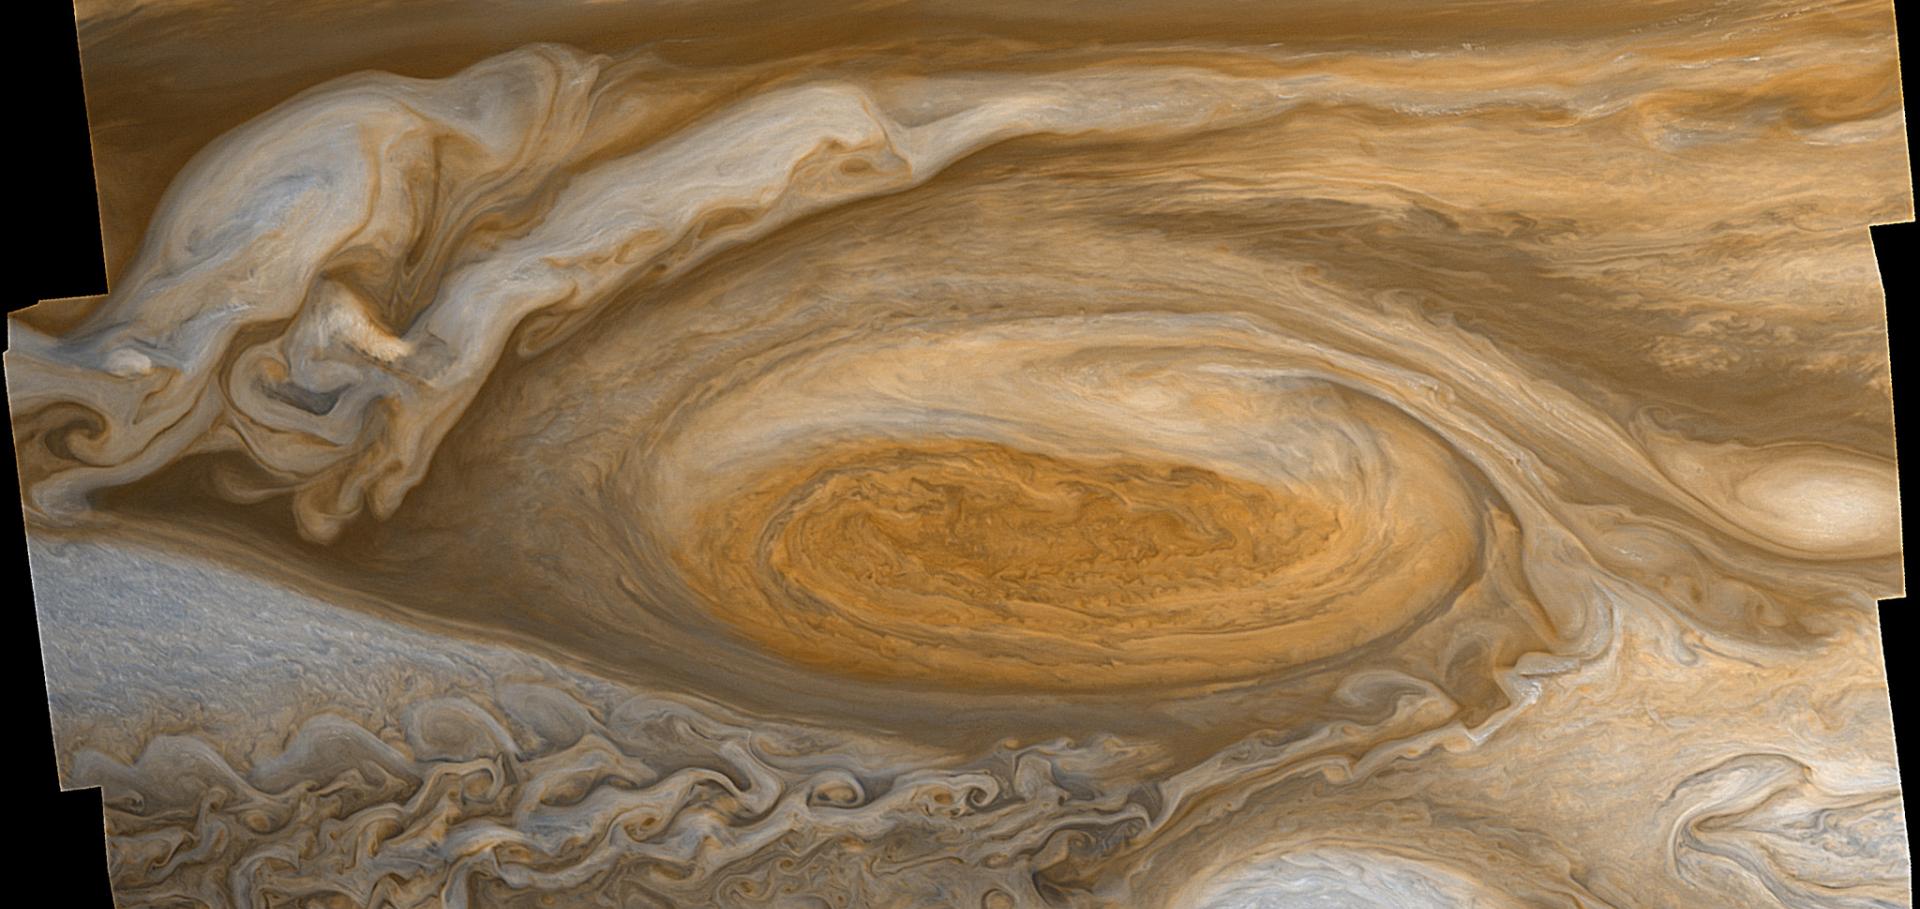
Image of Jupiter's Great Red Spot from Voyager 1

Image of Jupiter's Great Red Spot, obtained during the fly-by of Jupiter by NASA's Voyager 1 spacecraft in 1979.

Credit: NASA/JPL

Prof. Peter Read

Emeritus/researcher

Research theme

  • Climate physics
  • Exoplanets and planetary physics

Sub department

  • Atmospheric, Oceanic and Planetary Physics

Research groups

  • Geophysical and Astrophysical Fluid Dynamics
  • Planetary Climate Dynamics
Peter.Read@physics.ox.ac.uk
Telephone: 01865 (2)72082
Atmospheric Physics Clarendon Laboratory, room 210
  • About
  • Publications

Jupiter's and Saturn's convectively driven banded jets in the laboratory

Geophysical Research Letters 31:22 (2004) 1-5

Authors:

PL Read, YH Yamazaki, SR Lewis, PD Williams, K Miki-Yamazaki, J Sommeria, H Didelle, A Fincham

Abstract:

The banded patterns of cloud and wind are among the most striking features of the atmospheres of Jupiter and Saturn, but their dynamical origin remains poorly understood. Most approaches towards understanding zonation so far (also in the terrestrial oceans) have used highly idealized models to show that it might originate from dynamical anisotropy in a shallow turbulent fluid layer due to the planetary β-effect. Here we report the results of laboratory experiments, conducted on a 14-m diameter turntable, which quantitatively confirm that multiple zonal jets may indeed be generated and maintained by this mechanism in the presence of deep convection and a topographic β-effect. At the very small values of Ekman number (≤2 × 10⁻⁵) and large local Reynolds numbers (≥2000, based onjet scales) achieved, the kinetic energy spectra suggest the presence of both energy-cascading and enstrophy-cascading inertial ranges in addition to the zonation near twice the Rhines wave number. Copyright 2004 by the American Geophysical Union.
More details from the publisher

Dynamics of Jupiter's atmosphere

Chapter in Jupiter, Cambridge Univ Pr (2004) 105-128

Authors:

A Ingersoll, TE Dowling, PJ Gierasch, GS Orton, PL Read, A Sánchez-Lavega, AP Showman, AA Simon-Miller, AR Vasavada

Abstract:

Banded structure: belts and zones, changes in zonal velocity, evidence of upwelling and downwelling; Dicrete features: great red spot, white ovals and other anticyclones, cyclonic features, eddy momentum flux; Temperatures and vertical structure: global temperature variations, thermal waves, vertical structure - winds, temperature; Moist convection and lightning: lightning distribution, convective heat flux and structure of the lightning clouds, energy of lightning flashes, depth of lightning, models of moist convection; Models of the zonal jets: banding controlled in the weather layer, deep winds and stability of the jets, banding controlled in the interior, modes of internal heat transfer, banding controlled by tides, equatorial superrotation; Models of discrete features: stabel vortices, statistical mechanics models, equatorial hot spots and the Galileo probe; Unanswered questions and possible solutions.

Jupiter's and Saturn's convectively driven banded jets in the laboratory

Geophysical Research Letters 31 (2004) L22701 5pp

Authors:

Y Yamazaki, P.L. Read, J. Sommeria, P.D. Williams
More details from the publisher
More details

Investigating atmospheric predictability on Mars using breeding vectors in a general-circulation model

Quarterly Journal of the Royal Meteorological Society 130:603 PART B (2004) 2971-2989

Authors:

CE Newman, PL Read, SR Lewis

Abstract:

A breeding vectors approach is used to investigate the hypothesis that the Martian atmosphere is predictable at certain times of year, by identifying the fastest-growing modes of instability ar different times in a Mars general-circulation model. Results indicate that the period from northern mid-spring until mid-autumn is remarkably predictable, with negative global growth rates for a range of conditions, in contrast to the situation on the earth. From northern late autumn to early spring growing modes do occur, peaking in northern high latitudes and near winter solstice. Reducing the size of the initial perturbations increases global growth rates in most cases, supporting the idea that instabilities which saturate nonlinearly at lower amplitudes have generally faster growth rates. In late autumn/early winter the fastest-growing modes ('bred vectors') are around the north pole, increase with dust loading, and probably grow via barotropic as well as baroclinic energy conversion. In northern late winter/early spring the bred vectors are around the north pole and are strongly baroclinic in nature. As dust loading (and with it the global circulation strength) is increased their growth rates first decrease, as the baroclinic mode is suppressed, then increase again as the fastest-growing instabilities switch to being those which dominated earlier in the year. If dust levels are very low during late northern autumn (late southern spring) then baroclinic modes are also found around the spring pole in the south, though for a slight increase in dust loading the dominant modes shift back to northern high latitudes. The bred vectors are also used as perturbations to the initial conditions for ensemble simulations. One possible application within the Mars model is as a means of identifying regions and times when dust-lifting activity (related to surface wind stress) might show significant interannual variability for a given model configuration, without the need to perform long, computationally expensive multi-year model runs with each new set-up. This is tested for a time of year when previous multi-year experiments showed significant variability in dust storm onset in the region north of Chryse. Despite the model having no feedbacks between dust lifting and atmospheric state (unlike the original multi-year mn), the ensemble members still show maximum divergence in this region in terms of near-surface wind stress, suggesting both that this application deserves further testing, and that the intrinsic atmospheric variability alone may be important in producing interannual variability in this storm type. © Royal Meteorological Society, 2004.
More details from the publisher
More details

Jupiter's atmospheric composition from the Cassini thermal infrared spectroscopy experiment.

Science 305:5690 (2004) 1582-1586

Authors:

VG Kunde, FM Flasar, DE Jennings, B Bézard, DF Strobel, BJ Conrath, CA Nixon, GL Bjoraker, PN Romani, RK Achterberg, AA Simon-Miller, P Irwin, JC Brasunas, JC Pearl, MD Smith, GS Orton, PJ Gierasch, LJ Spilker, RC Carlson, AA Mamoutkine, SB Calcutt, PL Read, FW Taylor, T Fouchet, P Parrish, A Barucci, R Courtin, A Coustenis, D Gautier, E Lellouch, A Marten, R Prangé, Y Biraud, C Ferrari, TC Owen, MM Abbas, RE Samuelson, F Raulin, P Ade, CJ Césarsky, KU Grossman, A Coradini

Abstract:

The Composite Infrared Spectrometer observed Jupiter in the thermal infrared during the swing-by of the Cassini spacecraft. Results include the detection of two new stratospheric species, the methyl radical and diacetylene, gaseous species present in the north and south auroral infrared hot spots; determination of the variations with latitude of acetylene and ethane, the latter a tracer of atmospheric motion; observations of unexpected spatial distributions of carbon dioxide and hydrogen cyanide, both considered to be products of comet Shoemaker-Levy 9 impacts; characterization of the morphology of the auroral infrared hot spot acetylene emission; and a new evaluation of the energetics of the northern auroral infrared hot spot.
More details from the publisher
More details

Pagination

  • First page First
  • Previous page Prev
  • …
  • Page 34
  • Page 35
  • Page 36
  • Page 37
  • Current page 38
  • Page 39
  • Page 40
  • Page 41
  • Page 42
  • …
  • Next page Next
  • Last page Last

Footer Menu

  • Contact us
  • Giving to the Dept of Physics
  • Work with us
  • Media

User account menu

  • Log in

Follow us

FIND US

Clarendon Laboratory,

Parks Road,

Oxford,

OX1 3PU

CONTACT US

Tel: +44(0)1865272200

University of Oxfrod logo Department Of Physics text logo
IOP Juno Champion logo Athena Swan Silver Award logo

© University of Oxford - Department of Physics

Cookies | Privacy policy | Accessibility statement

Built by: Versantus

  • Home
  • Research
  • Study
  • Engage
  • Our people
  • News & Comment
  • Events
  • Our facilities & services
  • About us
  • Current students
  • Staff intranet