Scientific goals for the observation of Venus by VIRTIS on ESA/Venus express mission
Planetary and Space Science 55:12 (2007) 1653-1672
Abstract:
The Visible and Infrared Thermal Imaging Spectrometer (VIRTIS) on board the ESA/Venus Express mission has technical specifications well suited for many science objectives of Venus exploration. VIRTIS will both comprehensively explore a plethora of atmospheric properties and processes and map optical properties of the surface through its three channels, VIRTIS-M-vis (imaging spectrometer in the 0.3-1 μm range), VIRTIS-M-IR (imaging spectrometer in the 1-5 μm range) and VIRTIS-H (aperture high-resolution spectrometer in the 2-5 μm range). The atmospheric composition below the clouds will be repeatedly measured in the night side infrared windows over a wide range of latitudes and longitudes, thereby providing information on Venus's chemical cycles. In particular, CO, H2O, OCS and SO2 can be studied. The cloud structure will be repeatedly mapped from the brightness contrasts in the near-infrared night side windows, providing new insights into Venusian meteorology. The global circulation and local dynamics of Venus will be extensively studied from infrared and visible spectral images. The thermal structure above the clouds will be retrieved in the night side using the 4.3 μm fundamental band of CO2. The surface of Venus is detectable in the short-wave infrared windows on the night side at 1.01, 1.10 and 1.18 μm, providing constraints on surface properties and the extent of active volcanism. Many more tentative studies are also possible, such as lightning detection, the composition of volcanic emissions, and mesospheric wave propagation. © 2007 Elsevier Ltd. All rights reserved.Meridional variations in stratospheric acetylene and ethane in the southern hemisphere of the saturnian atmosphere as determined from Cassini/CIRS measurements
Icarus Elsevier 190:2 (2007) 556-572
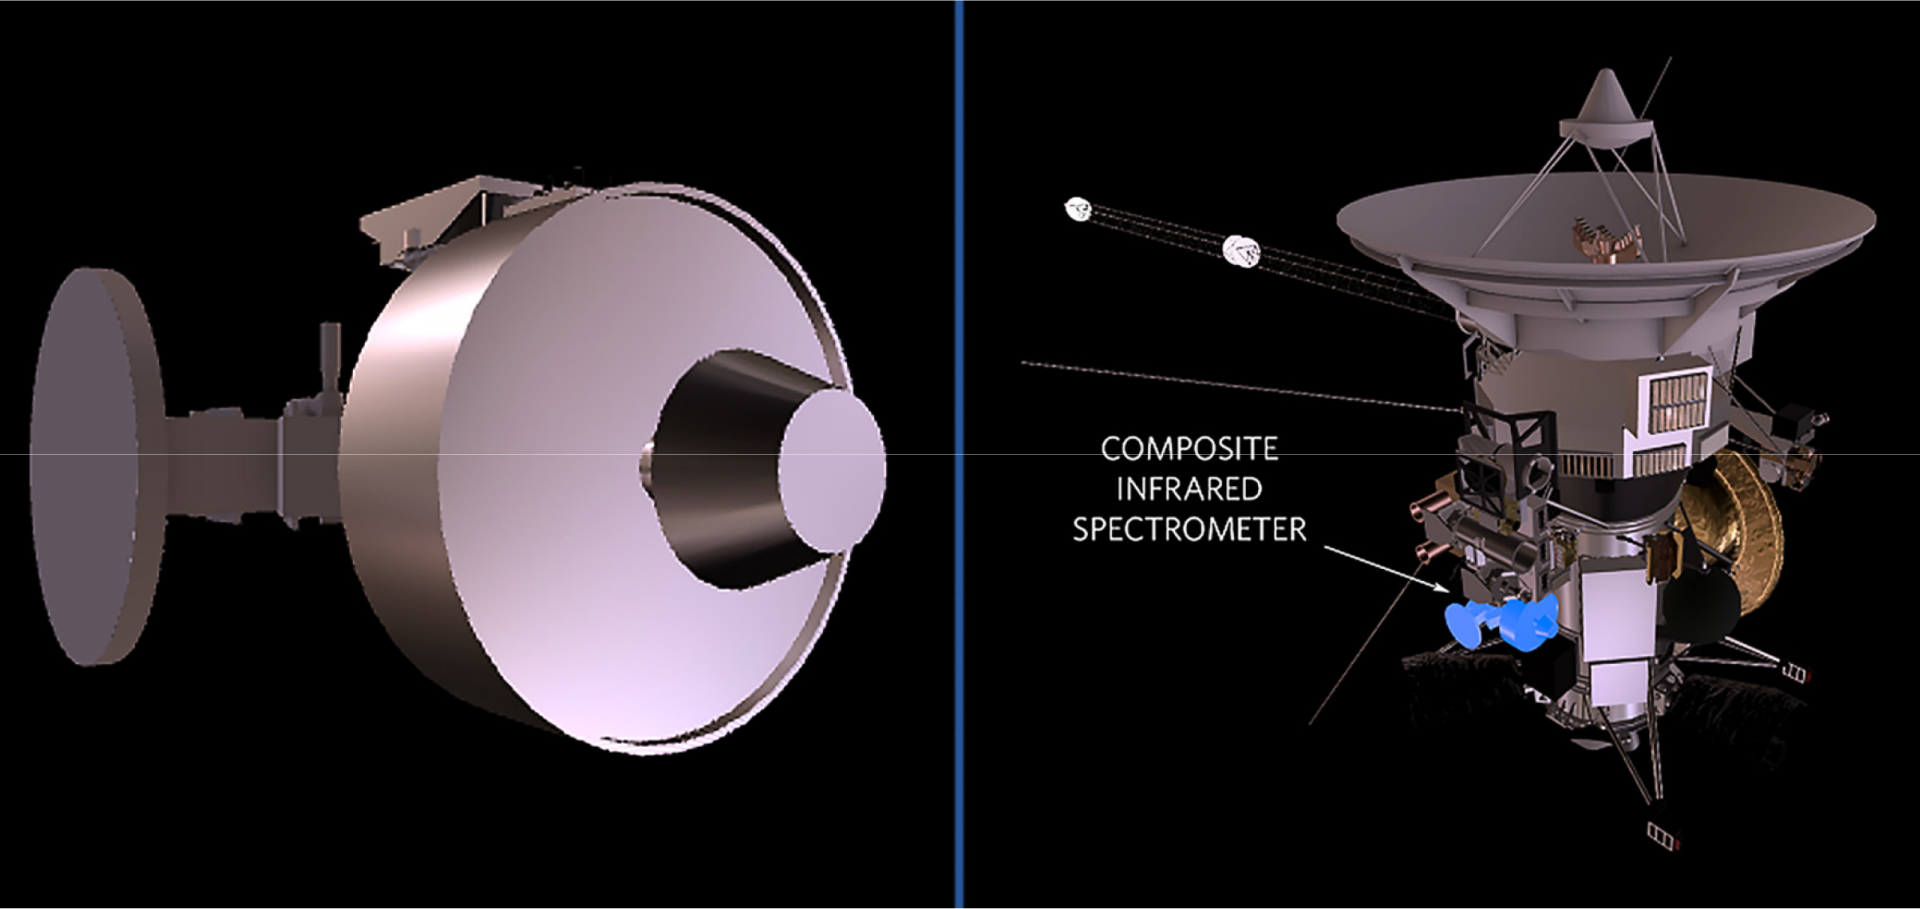
Characterising Saturn's vertical temperature structure from Cassini/CIRS
Icarus 189:2 (2007) 457-478
Abstract:
Thermal infrared spectra of Saturn from 10-1400 cm-1 at 15 cm-1 spectral resolution and a spatial resolution of 1°-2° latitude have been obtained by the Cassini Composite Infrared Spectrometer [Flasar, F.M., and 44 colleagues, 2004. Space Sci. Rev. 115, 169-297]. Many thousands of spectra, acquired over eighteen-months of observations, are analysed using an optimal estimation retrieval code [Irwin, P.G.J., Parrish, P., Fouchet, T., Calcutt, S.B., Taylor, F.W., Simon-Miller, A.A., Nixon, C.A., 2004. Icarus 172, 37-49] to retrieve the temperature structure and para-hydrogen distribution over Saturn's northern (winter) and southern (summer) hemispheres. The vertical temperature structure is analysed in detail to study seasonal asymmetries in the tropopause height (65-90 mbar), the location of the radiative-convective boundary (350-500 mbar), and the variation with latitude of a temperature knee (between 150 and 300 mbar) which was first observed in inversions of Voyager/IRIS spectra [Hanel, R., and 15 colleagues, 1981. Science 212, 192-200; Hanel, R., Conrath, B., Flasar, F.M., Kunde, V., Maguire, W., Pearl, J.C., Pirraglia, J., Samuelson, R., Cruikshank, D.P., Gautier, D., Gierasch, P.J., Horn, L., Ponnamperuma, C., 1982. Science 215, 544-548]. Uncertainties due to both the modelling of spectral absorptions (collision-induced absorption coefficients, tropospheric hazes, helium abundance) and the nature of our retrieval algorithm are quantified. Temperatures in the stratosphere near 1 mbar show a 25-30 K temperature difference between the north pole and south pole. This asymmetry becomes less pronounced with depth as the radiative time constant for the atmospheric response increases at deeper pressure levels. Hemispherically-symmetric small-scale temperature structures associated with zonal winds are superimposed onto the temperature asymmetry for pressures greater than 100 mbar. The para-hydrogen fraction in the 100-400 mbar range is greater than equilibrium predictions for the southern hemisphere and parts of the northern hemisphere, and less than equilibrium predictions polewards of 40° N. The temperature knee between 150-300 mbar is larger in the summer hemisphere than in the winter, smaller and higher at the equator, deeper and larger in the equatorial belts and small at the poles. Solar heating on tropospheric haze is proposed as a possible mechanism for this effect; the increased efficiency of ortho- to para-hydrogen conversion in the southern hemisphere is consistent with the presence of larger aerosols in the summer hemisphere, which we demonstrate to be qualitatively consistent with previous studies of Saturn's tropospheric aerosol distribution. © 2007 Elsevier Inc. All rights reserved.Characterising Saturn's vertical temperature structure from Cassini/CIRS
Icarus 189 (2007) 457-478
Characterising Saturn's vertical temperature structure from Cassini/CIRS
Icarus Elsevier 189:2 (2007) 457-478