Home
Department Of Physics text logo
  • Research
    • Our research
    • Our research groups
    • Our research in action
    • Research funding support
    • Summer internships for undergraduates
  • Study
    • Undergraduates
    • Postgraduates
  • Engage
    • For alumni
    • For business
    • For schools
    • For the public
Menu
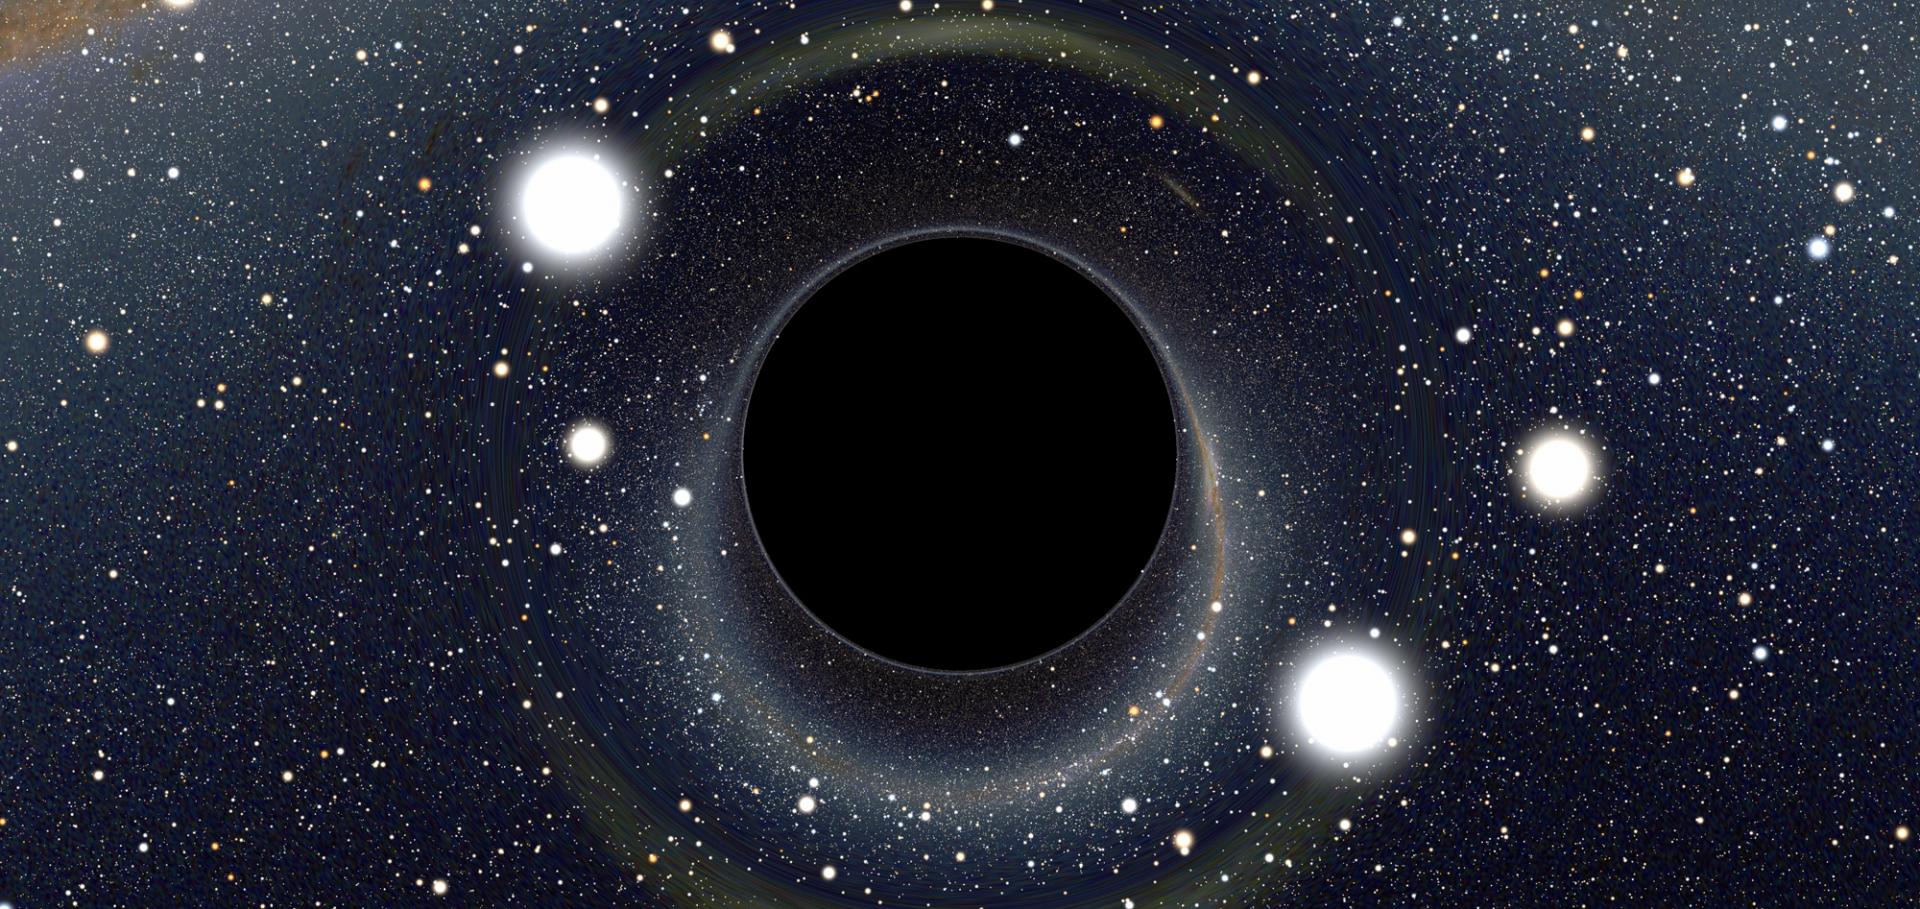
Black Hole

Lensing of space time around a black hole. At Oxford we study black holes observationally and theoretically on all size and time scales - it is some of our core work.

Credit: ALAIN RIAZUELO, IAP/UPMC/CNRS. CLICK HERE TO VIEW MORE IMAGES.

Andrew Bunker

Professor of Astrophysics

Research theme

  • Astronomy and astrophysics

Sub department

  • Astrophysics

Research groups

  • Galaxy formation and evolution
Andy.Bunker@physics.ox.ac.uk
Telephone: 01865 (2)83126
Denys Wilkinson Building, room 702
  • About
  • Publications

Spectroscopy with the JWST Advanced Deep Extragalactic Survey (JADES) - the NIRSpec/NIRCAM GTO galaxy evolution project

Proceedings of the International Astronomical Union Cambridge University Press (CUP) 15:S352 (2019) 342-346
More details from the publisher

The energetics of starburst-driven outflows at z ∼ 1 from KMOS

Monthly Notices of the Royal Astronomical Society Oxford University Press 487:1 (2019) 381-393

Authors:

AM Swinbank, CM Harrison, AL Tiley, HL Johnson, I Smail, JP Stott, PN Best, RG Bower, Martin Bureau, A Bunker, M Cirasuolo, M Jarvis, GE Magdis, RM Sharples, D Sobral

Abstract:

We present an analysis of the gas outflow energetics from KMOS observations of ∼ 529 main-sequence star-forming galaxies at z ∼ 1 using broad, underlying H α and forbidden lines of [N II] and [S II]. Based on the stacked spectra for a sample with median star-formation rates and stellar masses of SFR = 7 M⊙   yr−1 and M⋆ = (1.0 ± 0.1) × 1010 M⊙, respectively, we derive a typical mass outflow rate of M˙wind = 1–4 M⊙ yr−1 and a mass loading of M˙wind / SFR = 0.2–0.4. By comparing the kinetic energy in the wind with the energy released by supernovae, we estimate a coupling efficiency between the star formation and wind energetics of ϵ ∼  0.03. The mass loading of the wind does not show a strong trend with star-formation rate over the range ∼ 2–20 M⊙ yr−1, although we identify a trend with stellar mass such that dM / dt / SFR ∝ M0.26±0.07⋆⁠. Finally, the line width of the broad H α increases with disc circular velocity with a sub-linear scaling relation FWHMbroad ∝ v0.21 ± 0.05. As a result of this behaviour, in the lowest mass galaxies (M⋆ ≲ 1010 M⊙), a significant fraction of the outflowing gas should have sufficient velocity to escape the gravitational potential of the halo whilst in the highest mass galaxies (M⋆ ≳ 1010 M⊙) most of the gas will be retained, flowing back on to the galaxy disc at later times.
More details from the publisher
Details from ORA
More details
Details from ArXiV

Simulating and interpreting deep observations in the Hubble Ultra Deep Field with the JWST/NIRSpec low-resolution ‘prism’

Monthly Notices of the Royal Astronomical Society Oxford University Press (OUP) 483:2 (2019) 2621-2640

Authors:

Jacopo Chevallard, Emma Curtis-Lake, Stéphane Charlot, Pierre Ferruit, Giovanna Giardino, Marijn Franx, Michael V Maseda, Ricardo Amorin, Santiago Arribas, Andy Bunker, Stefano Carniani, Bernd Husemann, Peter Jakobsen, Roberto Maiolino, Janine Pforr, Timothy D Rawle, Hans-Walter Rix, Renske Smit, Chris J Willott
More details from the publisher
Details from ORA
More details
Details from ArXiV

The shapes of the rotation curves of star-forming galaxies over the last ≈10 Gyr

Monthly Notices of the Royal Astronomical Society Oxford University Press 485:1 (2019) 934-960

Authors:

AL Tiley, AM Swinbank, CM Harrison, I Smail, OJ Turner, M Schaller, JP Stott, D Sobral, T Theuns, RM Sharples, S Gillman, RG Bower, Andrew J Bunker, P Best, J Richard, R Bacon, Martin Bureau, M Cirasuolo, G Magdis

Abstract:

We analyse maps of the spatially resolved nebular emission of ≈1500 star-forming galaxies at z ≈ 0.6–2.2 from deep K-band Multi-Object Spectrograph and MUSE observations to measure the average shape of their rotation curves. We use these to test claims for declining rotation curves at large radii in galaxies at z ≈ 1–2 that have been interpreted as evidence for an absence of dark matter. We show that the shape of the average rotation curves, and the extent to which they decline beyond their peak velocities, depends upon the normalization prescription used to construct the average curve. Normalizing in size by the galaxy stellar disc-scale length after accounting for seeing effects (R d), we construct stacked position-velocity diagrams that trace the average galaxy rotation curve out to 6R d (≈13 kpc, on average). Combining these curves with average H I rotation curves for local systems, we investigate how the shapes of galaxy rotation curves evolve over ≈10 Gyr. The average rotation curve for galaxies binned in stellar mass, stellar surface mass density and/or redshift is approximately flat, or continues to rise, out to at least 6R d. We find a trend between the outer slopes of galaxies’ rotation curves and their stellar mass surface densities, with the higher surface density systems exhibiting flatter rotation curves. Drawing comparisons with hydrodynamical simulations, we show that the average shapes of the rotation curves for our sample of massive, star-forming galaxies at z ≈ 0–2.2 are consistent with those expected from lambda cold dark matter theory and imply dark matter fractions within 6Rd of at least ≈60 per cent.
More details from the publisher
Details from ORA
More details
Details from ArXiV

The Shapes of the Rotation Curves of Star-forming Galaxies Over the Last $\approx$10 Gyr

(2018)

Authors:

Alfred L Tiley, AM Swinbank, CM Harrison, Ian Smail, OJ Turner, M Schaller, JP Stott, D Sobral, T Theuns, RM Sharples, S Gillman, RG Bower, AJ Bunker, P Best, J Richard, Roland Bacon, M Bureau, M Cirasuolo, G Magdis
More details from the publisher

Pagination

  • First page First
  • Previous page Prev
  • …
  • Page 54
  • Page 55
  • Page 56
  • Page 57
  • Current page 58
  • Page 59
  • Page 60
  • Page 61
  • Page 62
  • …
  • Next page Next
  • Last page Last

Footer Menu

  • Contact us
  • Giving to the Dept of Physics
  • Work with us
  • Media

User account menu

  • Log in

Follow us

FIND US

Clarendon Laboratory,

Parks Road,

Oxford,

OX1 3PU

CONTACT US

Tel: +44(0)1865272200

University of Oxfrod logo Department Of Physics text logo
IOP Juno Champion logo Athena Swan Silver Award logo

© University of Oxford - Department of Physics

Cookies | Privacy policy | Accessibility statement

Built by: Versantus

  • Home
  • Research
  • Study
  • Engage
  • Our people
  • News & Comment
  • Events
  • Our facilities & services
  • About us
  • Current students
  • Staff intranet