
FMOS: The fiber multiple-object spectrograph VI: On board performances and results of the engineering observations
Proceedings of SPIE the International Society for Optical Engineering 7014 (2008)
Abstract:
FMOS: the Fiber Multiple-Object Spectrograph is the next common-use instrument of the Subaru Telescope, having a capability of 400 targets multiplicity in the near-infrared 0.9-1.8μm wavelength range with a field coverage of 30- diameter. FMOS consists of three units: 1) the prime focus unit including the corrector lenses, the Echidna fiber positioner, and the instrument-bay to adjust the instrument focus and shift the axis of the corrector lens system, 2) the fiber bundle unit equipping two fiber slits on one end and a fiber connector box with the back-illumination mechanism on the other end on the bundle, 3) the two infrared spectrographs (IRS1 and IRS2) to obtain 2×200 spectra simultaneously. After all the components were installed in the telescope at the end of 2007, the total performance was checked through various tests and engineering observations. We report the results of these tests and demonstrate the performance of FMOS.Implementation of differential wavefront sampling in optical alignment of pupil-segmented telescope systems
Proceedings of SPIE the International Society for Optical Engineering 7017 (2008)
Abstract:
We describe the implementation of differential wavefront sampling(DWS) in optical alignment of a pupilsegmented telescope system. As a wavefront-based optical alignment method, DWS can efficiently provide estimations of misalignments present in an optical system by deliberately perturbing optical elements in a systematic manner. This has been demonstrated in our previous numerical studies with realistic uncertainties in wavefront measurements, motion control, and optical surface deformations, suggesting that the method has potential in optical alignment and phasing of pupil-segmented systems such as the future Extremely Large Telescopes (ELTs). The basic idea and procedures of DWS are first described. We then present and discuss preliminary simulations using the currently proposed European Extremely Large Telescope (E-ELT) as an example system.Integration, commissioning and performance of the UK FMOS spectrograph
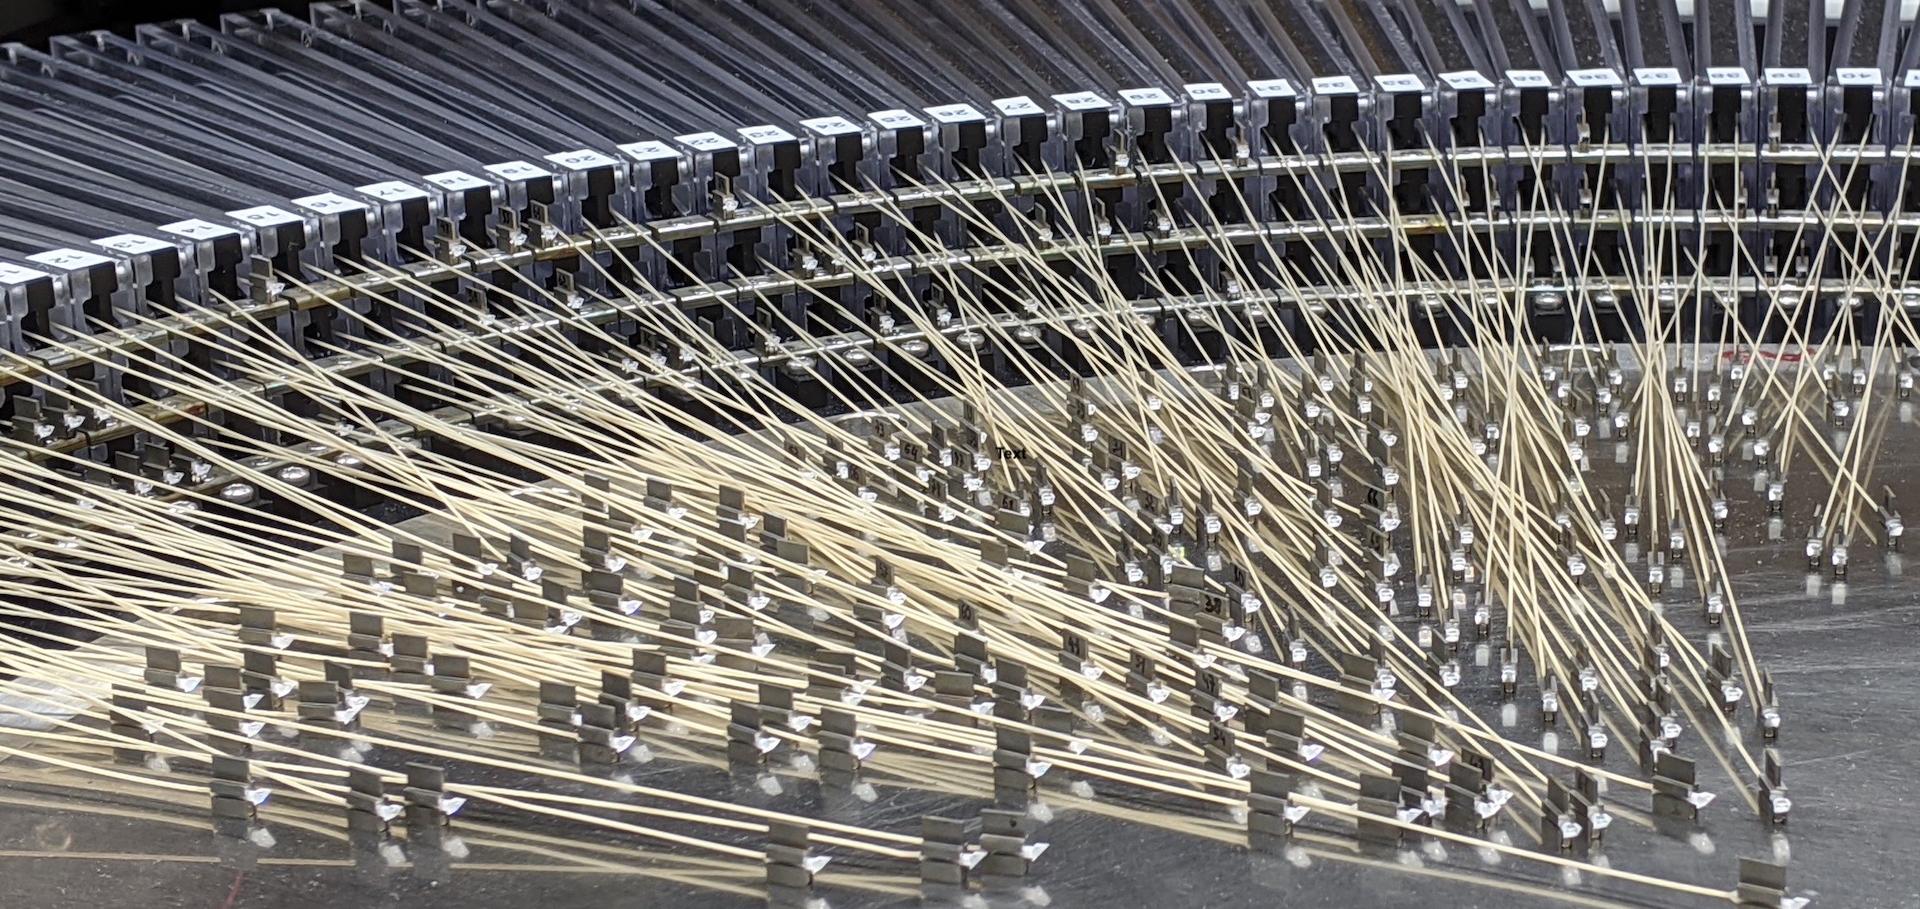
Proceedings of SPIE the International Society for Optical Engineering 7014 (2008)
Abstract:
The UK FMOS spectrograph forms part of Subaru's FMOS multi-object infrared spectroscopy facility. The spectrograph was shipped to Hilo in component form in August of 2007. We describe the integration sequence for the spectrograph, the results of cooldown tests using a new chiller unit fitted to the spectrograph at the telescope, and alignment tests of the spectrograph, gratings and OH-suppression masks. We present the first-light observations for the spectrograph from May 2008.Near-infrared bandpass filters with improved transparency for 1000nm spectral region using sputtered silicon compound films
Proceedings of SPIE the International Society for Optical Engineering 7018 (2008)
Abstract:
Near-infrared bandpass filters are commonly designed & manufactured using vacuum-evaporated films of Silicon and Silicon Monoxide. However the transparency of these filters is limited by optical absorption in the films when producing filters for wavelengths below 1200nm approximately. This work reports improvements in NIR filter transparency achieved by exploiting recent advances in magnetron sputtering technology. Sputtered silicon compound films have been used to demonstrate efficient bandpass filters for astronomy applications at wavelengths below 1000nm. This process technology allows a new selection of film materials to be used in design of NIR bandpass filters, with transmission and thermal drift characteristics which differ from conventional evaporated coatings. The spectral location of the bandpass is controlled by a non-optical method, which avoids the complex optical monitoring configurations normally required. The speed and flexibility of this process also offers a potential solution for projects which require small batches of custom NIR optical filters. Highly durable filters are obtained without elevated process temperature, which would otherwise be required in conventional evaporation processes. This avoids heating filter substrates which may be sensitive to thermal cycling effects. Attenuation of sidebands to T<0.0001 is reported across the spectral range of common sensor devices. The thermal sensitivity for cryostat applications is characterised and compared to conventional evaporated optical coatings. This method has been applied to 975nm & 985nm bandpass filters for use on VISTA project instrumentation. It also offers improvements for filters at longer wavelengths in the range 1000nm-5000nm. Some examples are reported in this region.Computer-guided alignment III: Description of inter-element alignment effect in circular-pupil optical systems
Optics Express 16:15 (2008) 10992-11006