


Integration, commissioning and performance of the UK FMOS spectrograph
Proceedings of SPIE the International Society for Optical Engineering 7014 (2008)
Abstract:
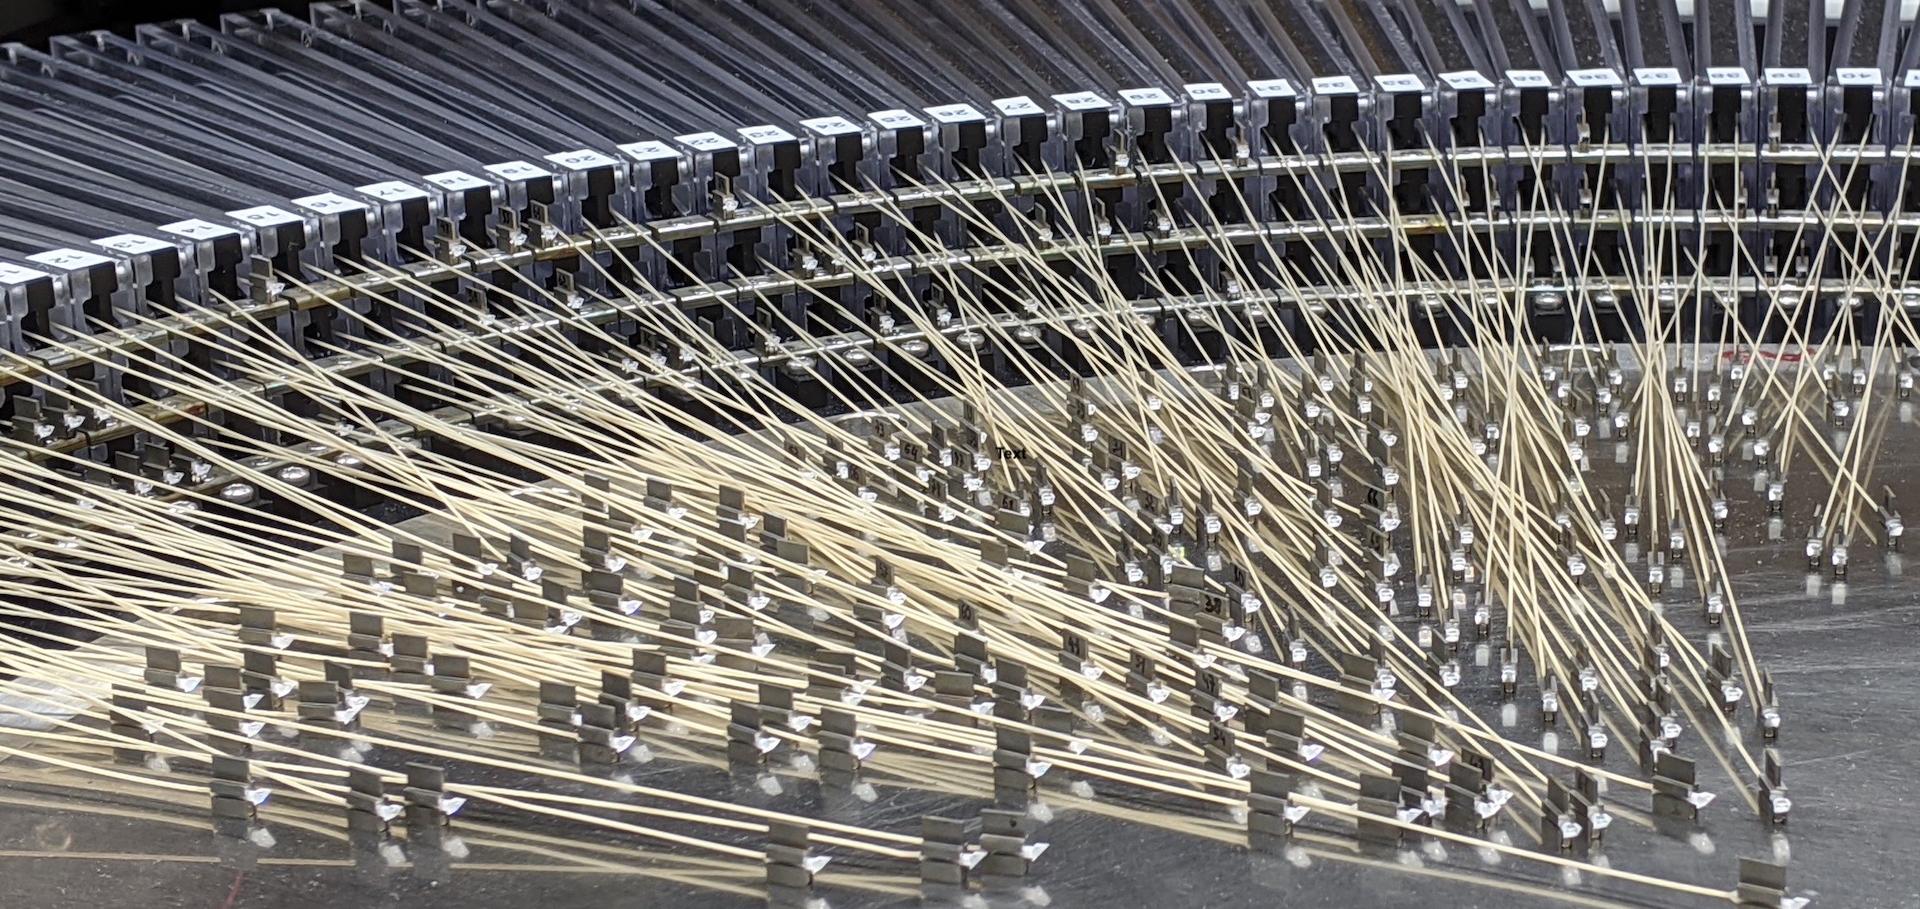
The UK FMOS spectrograph forms part of Subaru's FMOS multi-object infrared spectroscopy facility. The spectrograph was shipped to Hilo in component form in August of 2007. We describe the integration sequence for the spectrograph, the results of cooldown tests using a new chiller unit fitted to the spectrograph at the telescope, and alignment tests of the spectrograph, gratings and OH-suppression masks. We present the first-light observations for the spectrograph from May 2008.Near-infrared bandpass filters with improved transparency for 1000nm spectral region using sputtered silicon compound films
Proceedings of SPIE the International Society for Optical Engineering 7018 (2008)
Abstract:
Near-infrared bandpass filters are commonly designed & manufactured using vacuum-evaporated films of Silicon and Silicon Monoxide. However the transparency of these filters is limited by optical absorption in the films when producing filters for wavelengths below 1200nm approximately. This work reports improvements in NIR filter transparency achieved by exploiting recent advances in magnetron sputtering technology. Sputtered silicon compound films have been used to demonstrate efficient bandpass filters for astronomy applications at wavelengths below 1000nm. This process technology allows a new selection of film materials to be used in design of NIR bandpass filters, with transmission and thermal drift characteristics which differ from conventional evaporated coatings. The spectral location of the bandpass is controlled by a non-optical method, which avoids the complex optical monitoring configurations normally required. The speed and flexibility of this process also offers a potential solution for projects which require small batches of custom NIR optical filters. Highly durable filters are obtained without elevated process temperature, which would otherwise be required in conventional evaporation processes. This avoids heating filter substrates which may be sensitive to thermal cycling effects. Attenuation of sidebands to T<0.0001 is reported across the spectral range of common sensor devices. The thermal sensitivity for cryostat applications is characterised and compared to conventional evaporated optical coatings. This method has been applied to 975nm & 985nm bandpass filters for use on VISTA project instrumentation. It also offers improvements for filters at longer wavelengths in the range 1000nm-5000nm. Some examples are reported in this region.Computer-guided alignment III: Description of inter-element alignment effect in circular-pupil optical systems
Optics Express 16:15 (2008) 10992-11006
Abstract:
We present an analytic description of the inter-element alignment effect of misaligned optical systems with circular pupils. The description shows that decenter and tilt produce lateral displacement of the field and pupil coordinates, whilst a despace directly modifies the aberration coefficients by perturbing paraxial distances and scale factors of the two coordinates. This reveals that a misaligned surface not only changes its aberration characteristics, but also affects those of subsequent surfaces, which is the essence of the inter-element alignment effect. This description, combined with primary aberration theory, was applied to various misaligned systems to approximate their aberrations and alignment sensitivities given by ray-tracing. The results demonstrate the accuracy and robustness of this approach. We also discuss the potential usefulness of the description in estimating the axial separations between surfaces. © 2008 Optical Society of America.A novel design of a fibre-fed high-resolution spectrograph for WFMOS
Society of Photo-Optical Instrumentation Engineers (SPIE) 7014 (2008) 4-4
Development of non-hybridised HgCdTe detectors for the next generation of astronomical instrumentation
Society of Photo-Optical Instrumentation Engineers (SPIE) 7021 (2008) 0-0