
ANALYTICAL SOLUTION FOR WAVES IN PLANETS WITH ATMOSPHERIC SUPERROTATION. II. LAMB, SURFACE, AND CENTRIFUGAL WAVES
The Astrophysical Journal Supplement Series American Astronomical Society 213:1 (2014) 18
Characterizing exoplanets
Philosophical Transactions of the Royal Society A Mathematical Physical and Engineering Sciences The Royal Society 372:2014 (2014) 20130375
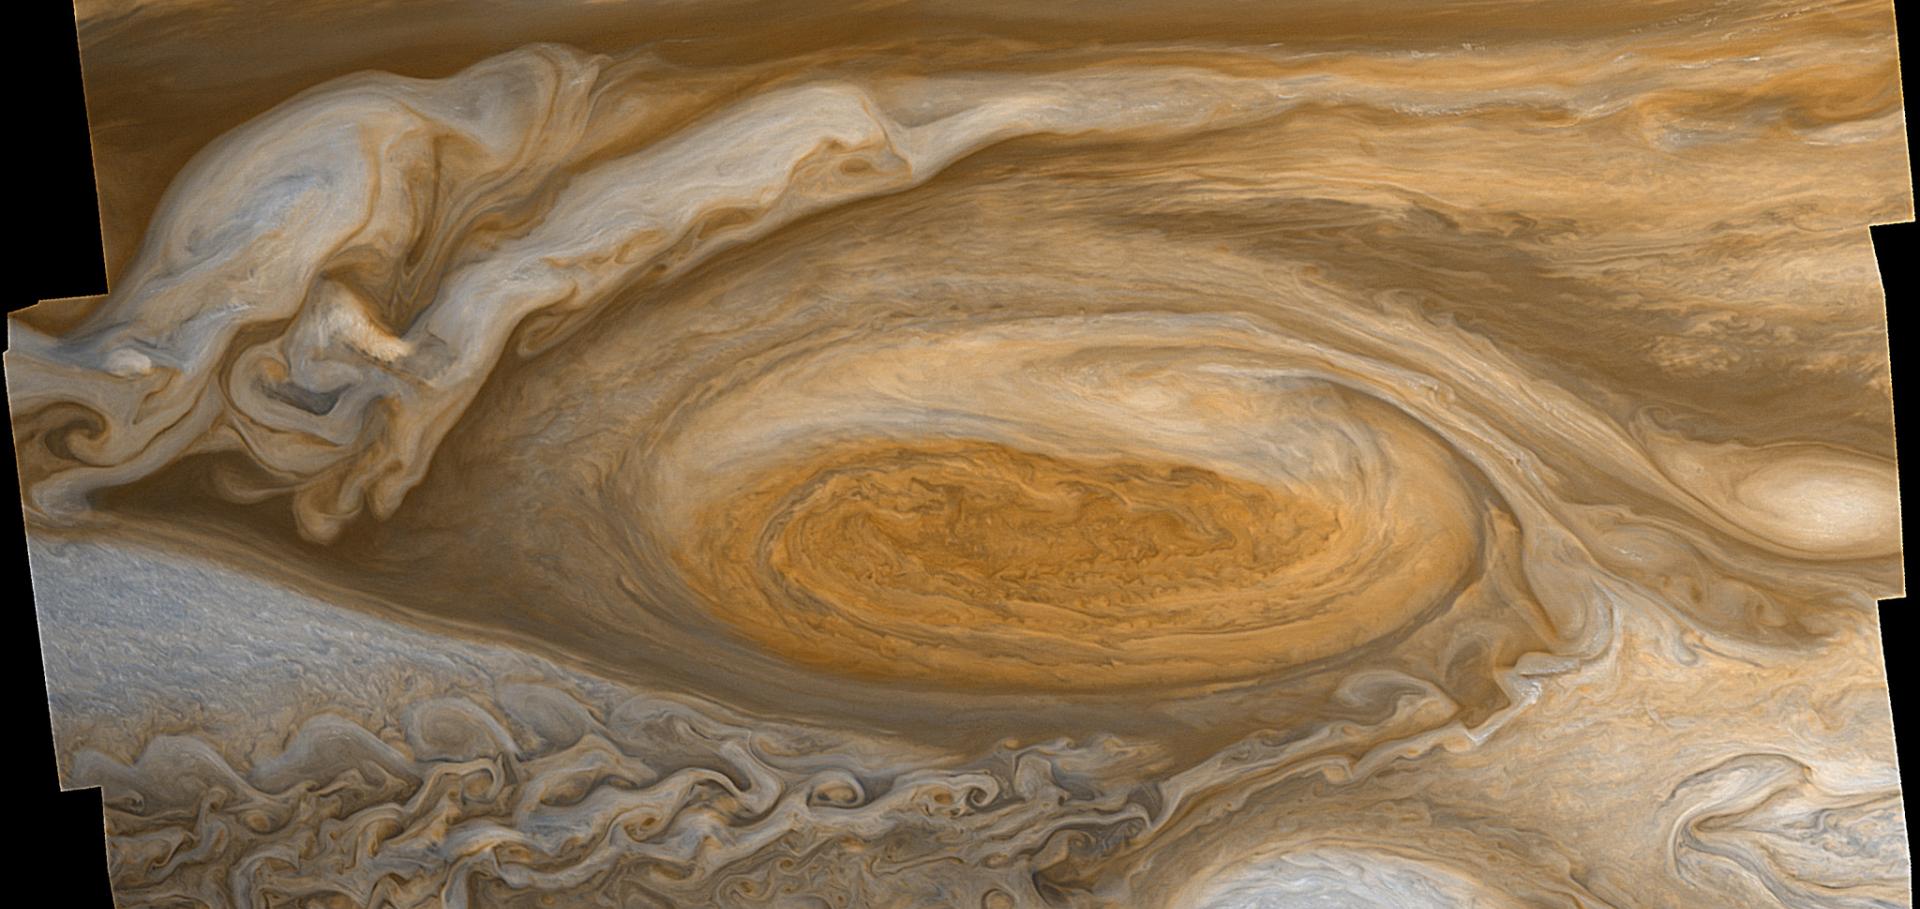
Cassini observations reveal a regime of zonostrophic macroturbulence on Jupiter
Icarus 229 (2014) 295-320
Abstract:
In December 2000, the Cassini fly-by near Jupiter delivered high-resolution images of Jupiter's clouds over the entire planet in a band between 50°N and 50°S. Three daily-averaged two-dimensional velocity snapshots extracted from these images are used to perform spectral analysis of jovian atmospheric macroturbulence. A similar analysis is also performed on alternative data documented by Choi and Showman (Choi, D., Showman, A. [2011]. Icarus 216, 597-609), based on a different method of image processing. The inter-comparison of the products of both analyses ensures a better constraint of the spectral estimates. Both analyses reveal strong anisotropy of the kinetic energy spectrum. The zonal spectrum is very steep and most of the kinetic energy resides in slowly evolving, alternating zonal (west-east) jets, while the non-zonal, or residual spectrum obeys the Kolmogorov-Kraichnan law specific to two-dimensional turbulence in the range of the inverse energy cascade. The spectral data is used to estimate the inverse cascade rate {small element of} and the zonostrophy index Rβ for the first time. Although both datasets yield somewhat different values of {small element of}, it is estimated to be in the range 0.5-1.0×10⁻⁵m2s-3. The ensuing values of Rβ≳5 belong well in the range of zonostrophic turbulence whose threshold corresponds to Rβ≃2.5. We infer that the large-scale circulation is maintained by an anisotropic inverse energy cascade. The removal of the Great Red Spot from both datasets has no significant effect upon either the spectra or the inverse cascade rate. The spectral data are used to compute the rate of the energy exchange, W, between the non-zonal structures and the large-scale zonal flow. It is found that instantaneous values of W may exceed {small element of} by an order of magnitude. Previous numerical simulations with a barotropic model suggest that W and {small element of} attain comparable values only after averaging of W over a sufficiently long time. Near-instantaneous values of W that have been routinely used to infer the rate of the kinetic energy supply to Jupiter's zonal flow may therefore significantly overestimate {small element of}. This disparity between W and {small element of} may resolve the long-standing conundrum of an unrealistically high rate of energy transfer to the zonal flow. The meridional diffusivity Kφ in the regime of zonostrophic turbulence is given by an expression that depends on {small element of}. The value of Kφ estimated from the spectra is compared against data from the dispersion of stratospheric gases and debris resulting from the Shoemaker-Levy 9 comet and Wesley asteroid impacts in 1994 and 2009 respectively. Not only is Kφ found to be consistent with estimates for both impacts, but the eddy diffusivity found from observations appears to be scale-independent. This behaviour could be a consequence of the interaction between anisotropic turbulence and Rossby waves specific to the regime of zonostrophic macroturbulence. © 2013 Elsevier Inc.On the stirring properties of the thermally-driven rotating annulus
PHYSICA D-NONLINEAR PHENOMENA 268 (2014) 50-58
Plumbing the depths of Uranus and Neptune
Nature Springer Nature 497:7449 (2013) 323-324