Home
Department Of Physics text logo
  • Research
    • Our research
    • Our research groups
    • Our research in action
    • Research funding support
    • Summer internships for undergraduates
  • Study
    • Undergraduates
    • Postgraduates
  • Engage
    • For alumni
    • For business
    • For schools
    • For the public
Menu
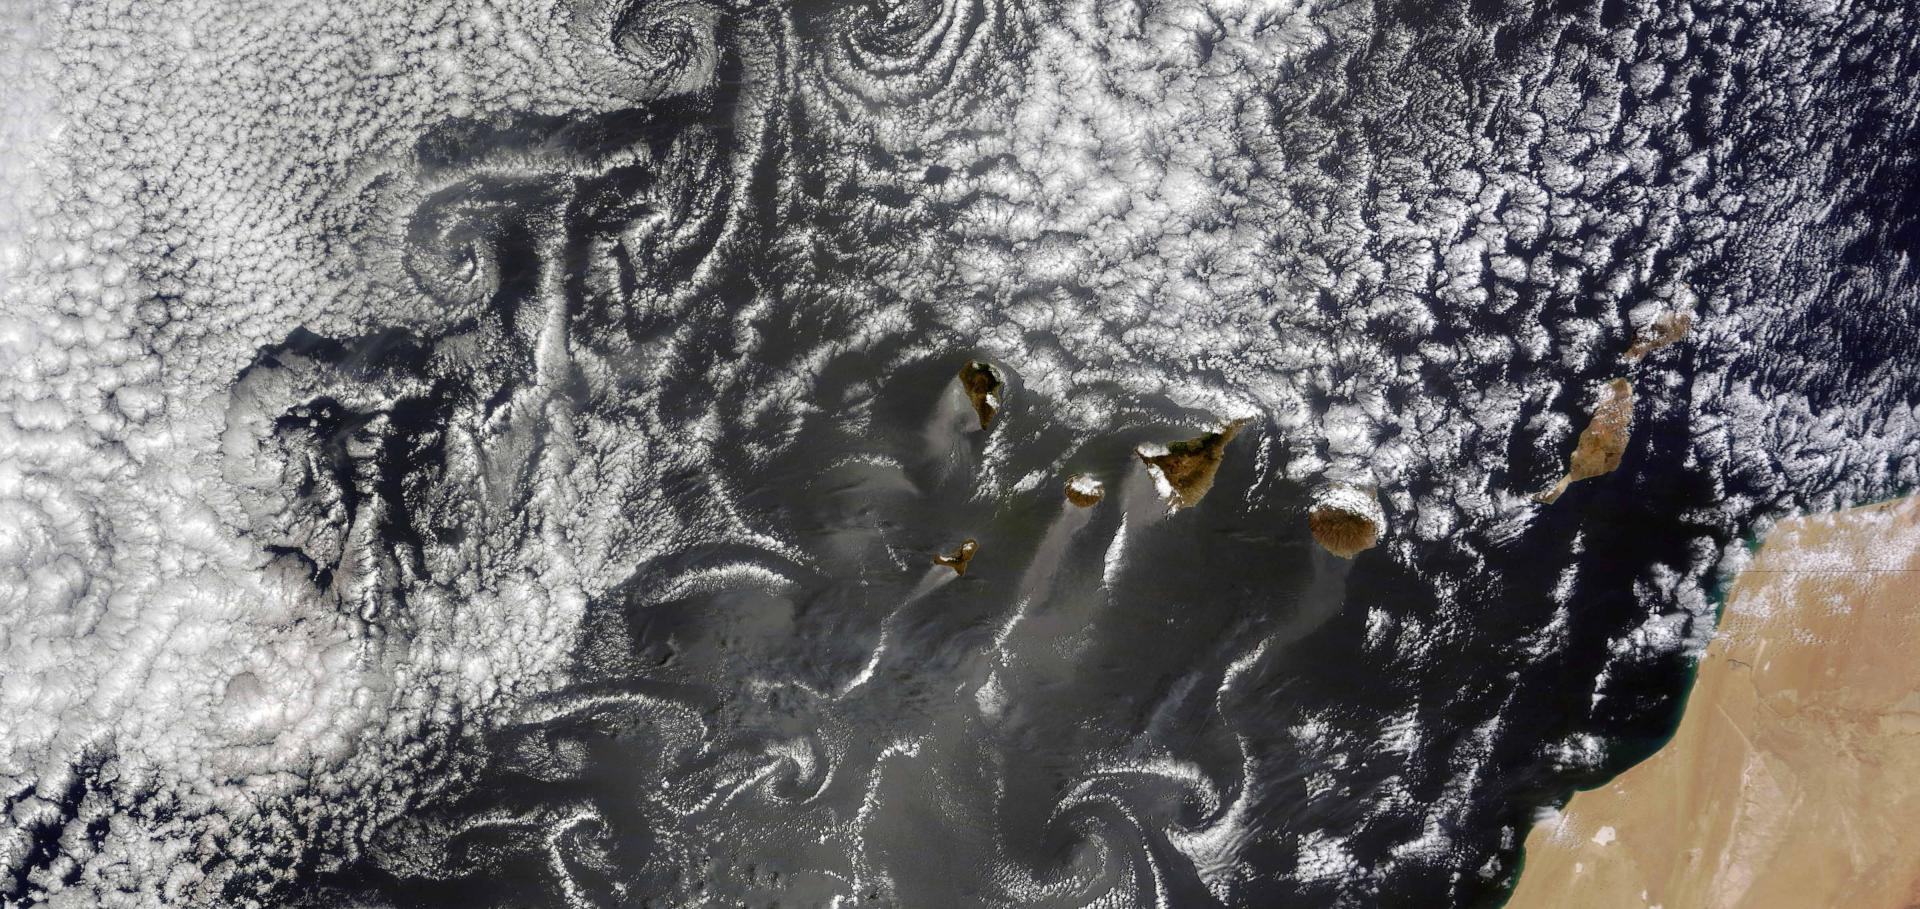
von Kármán vortex street over Canary Islands
Credit: NASA

Philip Stier

Professor of Atmospheric Physics

Research theme

  • Climate physics

Sub department

  • Atmospheric, Oceanic and Planetary Physics

Research groups

  • Climate processes
philip.stier@physics.ox.ac.uk
Telephone: 01865 (2)72887
Atmospheric Physics Clarendon Laboratory, room 103
  • About
  • Research
  • Teaching
  • CV
  • Publications

tobac v1.0: towards a flexible framework for tracking and analysis of clouds in diverse datasets

Geoscientific Model Development Discussions Copernicus GmbH (2019) 1-31

Authors:

Max Heikenfeld, Peter J Marinescu, Matthew Christensen, Duncan Watson-Parris, Fabian Senf, Susan C van den Heever, Philip Stier

Abstract:

<p><strong>Abstract.</strong> We introduce tobac (Tracking and Object-Based Analysis of Clouds), a newly developed framework for tracking and analysing individual clouds in different types of datasets, such as cloud-resolving model simulations and geostationary satellite retrievals. The software has been designed to be used flexibly with any two- or three-dimensional time-varying input. The application of high-level data formats, such as iris cubes or xarray arrays, for input and output allows for convenient use of metadata in the tracking analysis and visualisation. Comprehensive analysis routines are provided to derive properties like cloud lifetimes or statistics of cloud properties along with tools to visualise the results in a convenient way. The application of tobac is presented in two examples. We first track and analyse scattered deep convective cells based on maximum vertical velocity and the three-dimensional condensate mixing ratio field in cloud-resolving model simulations. We also investigate the performance of the tracking algorithm for different choices of time resolution of the model output. In the second application, we show how the framework can be used to effectively combine information from two different types of datasets by simultaneously tracking convective clouds in model simulations and in geostationary satellite images based on outgoing longwave radiation. tobac provides a flexible new way to include the evolution of the characteristics of individual clouds in a range of important analyses like model intercomparison studies or model assessment based on observational data.</p>
More details from the publisher
Details from ORA

Anthropogenic aerosol forcing – insights from multiple estimates from aerosol-climate models with reduced complexity

Atmospheric Chemistry and Physics Copernicus GmbH 19:10 (2019) 6821-6841

Authors:

Stephanie Fiedler, Stefan Kinne, Wan Ting Katty Huang, Petri Räisänen, Declan O&amp;apos;Donnell, Nicolas Bellouin, Philip Stier, Joonas Merikanto, Twan van Noije, Risto Makkonen, Ulrike Lohmann

Abstract:

<p><strong>Abstract.</strong> This study assesses the change in anthropogenic aerosol forcing from the mid-1970s to the mid-2000s. Both decades had similar global-mean anthropogenic aerosol optical depths but substantially different global distributions. For both years, we quantify (i) the forcing spread due to model-internal variability and (ii) the forcing spread among models. Our assessment is based on new ensembles of atmosphere-only simulations with five state-of-the-art Earth system models. Four of these models will be used in the sixth Coupled Model Intercomparison Project (CMIP6; <span class="cit" id="xref_altparen.1"><a href="#bib1.bibx14">Eyring et al.</a>, <a href="#bib1.bibx14">2016</a></span>). Here, the complexity of the anthropogenic aerosol has been reduced in the participating models. In all our simulations, we prescribe the same patterns of the anthropogenic aerosol optical properties and associated effects on the cloud droplet number concentration. We calculate the instantaneous radiative forcing (RF) and the effective radiative forcing (ERF). Their difference defines the net contribution from rapid adjustments. Our simulations show a model spread in ERF from <span class="inline-formula">−0.4</span> to <span class="inline-formula">−0.9</span>&amp;thinsp;W&amp;thinsp;m<span class="inline-formula"><sup>−2</sup></span>. The standard deviation in annual ERF is 0.3&amp;thinsp;W&amp;thinsp;m<span class="inline-formula"><sup>−2</sup></span>, based on 180 individual estimates from each participating model. This result implies that identifying the model spread in ERF due to systematic differences requires averaging over a sufficiently large number of years. Moreover, we find almost identical ERFs for the mid-1970s and mid-2000s for individual models, although there are major model differences in natural aerosols and clouds. The model-ensemble mean ERF is <span class="inline-formula">−0.54</span>&amp;thinsp;W&amp;thinsp;m<span class="inline-formula"><sup>−2</sup></span> for the pre-industrial era to the mid-1970s and <span class="inline-formula">−0.59</span>&amp;thinsp;W&amp;thinsp;m<span class="inline-formula"><sup>−2</sup></span> for the pre-industrial era to the mid-2000s. Our result suggests that comparing ERF changes between two observable periods rather than absolute magnitudes relative to a poorly constrained pre-industrial state might provide a better test for a model's ability to represent transient climate changes.</p>
More details from the publisher
Details from ORA
More details

The global aerosol-climate model ECHAM6.3-HAM2.3-Part 1: Aerosol evaluation

GEOSCIENTIFIC MODEL DEVELOPMENT 12:4 (2019) 1643-1677

Authors:

Ina Tegen, David Neubauer, Sylvaine Ferrachat, Colombe Siegenthaler-Le Drian, Isabelle Bey, Nick Schutgens, Philip Stier, Duncan Watson-Parris, Tanja Stanelle, Hauke Schmidt, Sebastian Rast, Harri Kokkola, Martin Schultz, Sabine Schroeder, Nikos Daskalakis, Stefan Barthel, Bernd Heinold, Ulrike Lohmann
More details from the publisher
More details

Increased water vapour lifetime due to global warming

Atmospheric Chemistry and Physics Discussions Copernicus GmbH (2019) 1-17

Authors:

Øivind Hodnebrog, Gunnar Myhre, Bjørn H Samset, Kari Alterskjær, Timothy Andrews, Olivier Boucher, Gregory Faluvegi, Dagmar Fläschner, Piers M Forster, Matthew Kasoar, Alf Kirkevåg, Jean-Francois Lamarque, Dirk Olivié, Thomas B Richardson, Dilshad Shawki, Drew Shindell, Keith P Shine, Philip Stier, Toshihiko Takemura, Apostolos Voulgarakis, Duncan Watson-Parris

Abstract:

<p><strong>Abstract.</strong> The relationship between changes in integrated water vapour (IWV) and precipitation can be characterized by quantifying changes in atmospheric water vapour lifetime. Precipitation isotope ratios correlate with this lifetime, a relationship that helps understand dynamical processes and may lead to improved climate projections. We investigate how water vapour and its lifetime respond to different drivers of climate change, such as greenhouse gases and aerosols. Results from 11 global climate models have been used, based on simulations where CO<sub>2</sub>, methane, solar irradiance, black carbon (BC), and sulphate have been perturbed separately. A lifetime increase from 8 to 10&amp;thinsp;days is projected between 1986&amp;ndash;2005 and 2081&amp;ndash;2100, under a business-as-usual pathway. By disentangling contributions from individual climate drivers, we present a physical understanding of how global warming slows down the hydrological cycle, due to longer lifetime, but still amplifies the cycle due to stronger precipitation/evaporation fluxes. The feedback response of IWV to surface temperature change differs somewhat between drivers. Fast responses amplify these differences and lead to net changes in IWV per degree surface warming ranging from 6.4&amp;plusmn;0.9&amp;thinsp;%/K for sulphate to 9.8&amp;plusmn;2&amp;thinsp;%/K for BC. While BC is the driver with the strongest increase in IWV per degree surface warming, it is also the only driver with a reduction in precipitation per degree surface warming. Consequently, increases in BC aerosol concentrations yield the strongest slowdown of the hydrological cycle among the climate drivers studied, with a change in water vapour lifetime per degree surface warming of 1.1&amp;plusmn;0.4&amp;thinsp;days/K, compared to less than 0.5&amp;thinsp;days/K for the other climate drivers (CO<sub>2</sub>, methane, solar irradiance, sulphate).</p>
More details from the publisher
Details from ORA

The global aerosol-climate model ECHAM6.3-HAM2.3 – Part 2: Cloud evaluation, aerosol radiative forcing and climate sensitivity

Geoscientific Model Development Discussions Copernicus GmbH (2019) 1-52

Authors:

David Neubauer, Sylvaine Ferrachat, Colombe Siegenthaler-Le Drian, Philip Stier, Daniel G Partridge, Ina Tegen, Isabelle Bey, Tanja Stanelle, Harri Kokkola, Ulrike Lohmann

Abstract:

<p><strong>Abstract.</strong> The global aerosol-climate model ECHAM6.3-HAM2.3 (E63H23) and the previous model versions ECHAM5.5-HAM2.0 (E55H20) and ECHAM6.1-HAM2.2 (E61H22) are evaluated using global observational datasets for clouds and precipitation. In E63H23 low cloud amount, liquid and ice water path and cloud radiative effects are more realistic than in previous model versions. E63H23 has a more physically based aerosol activation scheme, improvements in the cloud cover scheme, changes in detrainment of convective clouds, changes in the sticking efficiency for accretion of ice crystals by snow, consistent ice crystal shapes throughout the model, changes in mixed phase freezing and an inconsistency in ice crystal number concentration (ICNC) in cirrus clouds was removed. Biases that were identified in E63H23 (and in previous model versions) are a too low cloud amount in stratocumulus regions, deep convective clouds in the Atlantic and Pacific oceans form too close to the continents and there are indications that ICNCs are overestimated.</p> <p>Since clouds are important for effective radiative forcing due to aerosol-radiation and aerosol-cloud interactions (ERF<sub>ari+aci</sub>) and equilibrium climate sensitivity (ECS), also differences in ERF<sub>ari+aci</sub> and ECS between the model versions were analyzed. ERF<sub>ari+aci</sub> is weaker in E63H23 (&amp;minus;1.0&amp;thinsp;W&amp;thinsp;m<sup>&amp;minus;2</sup>) than in E61H22 (&amp;minus;1.2&amp;thinsp;W&amp;thinsp;m<sup>&amp;minus;2</sup>) (or E55H20; &amp;minus;1.1&amp;thinsp;W&amp;thinsp;m<sup>&amp;minus;2</sup>). This is caused by the weaker shortwave ERF<sub>ari+aci</sub> (new aerosol activation scheme and sea salt emission parameterization in E63H23, more realistic simulation of cloud water) overcompensating the weaker longwave ERF<sub>ari+aci</sub> (removal of an inconsistency in ICNC in cirrus clouds in E61H22).</p> <p>The decrease in ECS in E63H23 (2.5&amp;thinsp;K) compared to E61H22 (2.8&amp;thinsp;K) is due to changes in the entrainment rate for shallow convection (affecting the cloud amount feedback) and a stronger cloud phase feedback.</p>
More details from the publisher
Details from ORA
More details

Pagination

  • First page First
  • Previous page Prev
  • …
  • Page 30
  • Page 31
  • Page 32
  • Page 33
  • Current page 34
  • Page 35
  • Page 36
  • Page 37
  • Page 38
  • …
  • Next page Next
  • Last page Last

Footer Menu

  • Contact us
  • Giving to the Dept of Physics
  • Work with us
  • Media

User account menu

  • Log in

Follow us

FIND US

Clarendon Laboratory,

Parks Road,

Oxford,

OX1 3PU

CONTACT US

Tel: +44(0)1865272200

University of Oxfrod logo Department Of Physics text logo
IOP Juno Champion logo Athena Swan Silver Award logo

© University of Oxford - Department of Physics

Cookies | Privacy policy | Accessibility statement

Built by: Versantus

  • Home
  • Research
  • Study
  • Engage
  • Our people
  • News & Comment
  • Events
  • Our facilities & services
  • About us
  • Current students
  • Staff intranet