Home
Department Of Physics text logo
  • Research
    • Our research
    • Our research groups
    • Our research in action
    • Research funding support
    • Summer internships for undergraduates
  • Study
    • Undergraduates
    • Postgraduates
  • Engage
    • For alumni
    • For business
    • For schools
    • For the public
  • Support
Menu
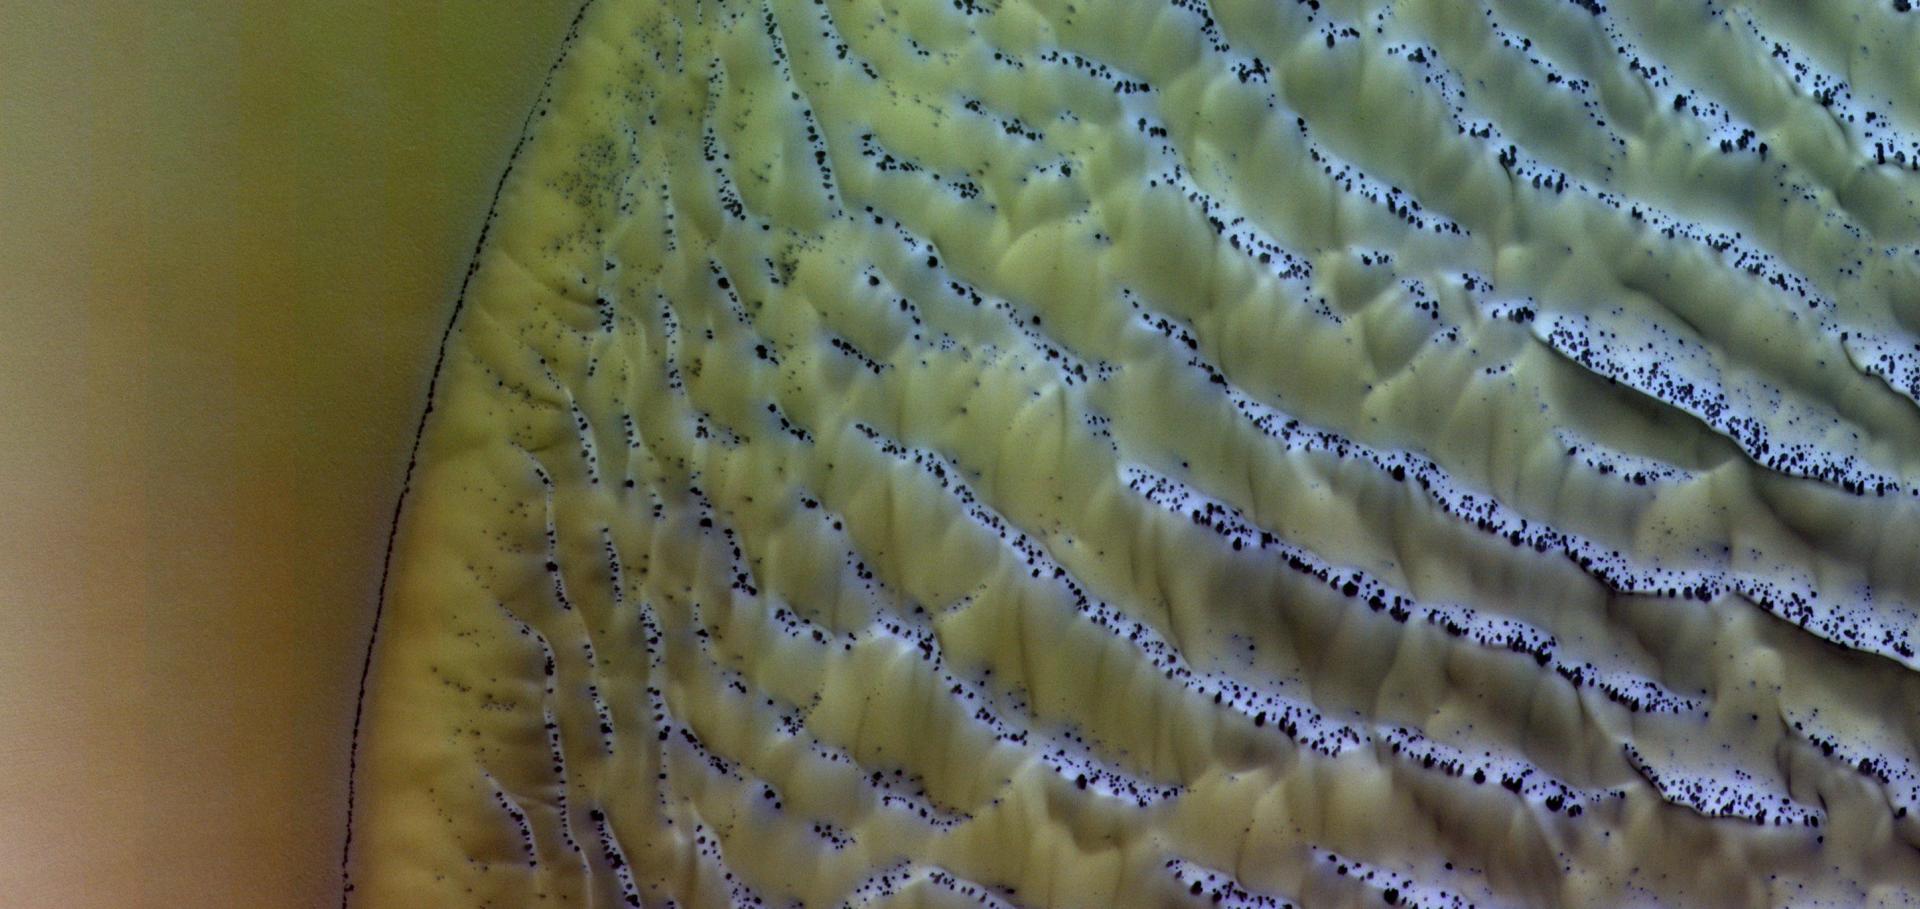
Dunes near Ulyxis Rupes by ExoMars TGO CaSSIS

Dunes near Ulyxis Rupes by ExoMars TGO CaSSIS

Credit: ESA/UBern

Dr Kevin Olsen

UKSA Mars Science Fellow

Research theme

  • Exoplanets and planetary physics

Sub department

  • Atmospheric, Oceanic and Planetary Physics

Research groups

  • Planetary atmosphere observation analysis
  • Planetary surfaces
  • Solar system
  • Space instrumentation
kevin.olsen@physics.ox.ac.uk
Atmospheric Physics Clarendon Laboratory
  • About
  • Publications

Seasonal changes in the vertical structure of ozone in the Martian lower atmosphere and its relationship to water vapor

Journal of Geophysical Research: Planets Wiley 127:10 (2022) e2022JE007213

Authors:

KS Olsen, AA Fedorova, A Trokhimovskiy, F Montmessin, F Lefèvre, O Korablev, L Baggio, F Forget, E Millour, A Bierjon, J Alday, CF Wilson, PGJ Irwin, DA Belyaev, A Patrakeev, A Shakun

Abstract:

The mid-infrared channel of the Atmospheric Chemistry Suite (ACS MIR) onboard the ExoMars Trace Gas Orbiter is capable of observing the infrared absorption of ozone (O3) in the atmosphere of Mars. During solar occulations, the 003←000 band (3,000-3,060 cm−1) is observed with spectral sampling of ∼0.045 cm−1. Around the equinoxes in both hemispheres and over the southern winters, we regularly observe around 200–500 ppbv of O3 below 30 km. The warm southern summers, near perihelion, produce enough atmospheric moisture that O3 is not detectable at all, and observations are rare even at high northern latitudes. During the northern summers, water vapor is restricted to below 10 km, and an O3 layer (100–300 ppbv) is visible between 20 and 30 km. At this same time, the aphelion cloud belt forms, condensing water vapor and allowing O3 to build up between 30 and 40 km. A comparison to vertical profiles of water vapor and temperature in each season reveals that water vapor abundance is controlled by atmospheric temperature, and H2O and O3 are anti-correlated as expected. When the atmosphere cools, over time or over altitude, water vapor condenses (observed as a reduction in its mixing ratio) and the production of odd hydrogen species is reduced, which allows O3 to build up. Conversely, warmer temperatures lead to water vapor enhancements and ozone loss. The LMD Mars Global Climate Model is able to reproduce vertical structure and seasonal changes of temperature, H2O, and O3 that we observe. However, the observed O3 abundance is larger by factors between 2 and 6, indicating important differences in the rate of odd-hydrogen photochemistry.
More details from the publisher
Details from ORA
More details

Seasonal reappearance of HCl in the atmosphere of Mars during the Mars year 35 dusty season

Astronomy and Astrophysics EDP Sciences 647:March 2021 (2021) A161

Authors:

Kevin Olsen, A Trokhimovskiy, L Montabone, Aa Fedorova, M Luginin, F Lefèvre, Oi Korablev, F Montmessin, F Forget, E Millour, L Baggio, Juan Alday Parejo, Cf Wilson, Patrick Irwin, Da Belyaev, A Patrakeev, A Shakun

Abstract:

HCl was discovered in the atmosphere of Mars for the first time during the global dust storm in Mars year (MY) 34 (July 2018) using the Atmospheric Chemistry Suite mid-infrared channel (ACS MIR) on the ExoMars Trace Gas Orbiter. The simultaneity of variations in dust and HCl, and a correlation between water vapour and HCl, led to the proposal of a novel surface-atmosphere coupling analogous to terrestrial HCl production in the troposphere from salt aerosols. After seasonal dust activity restarted in MY 35 (August 2020), we have been monitoring HCl activity to determine whether such a coupling was validated. Here we present a new technique for analyzing the absorption features of trace gases close to the ACS MIR noise level and report that HCl mixing ratios are observed to rapidly increase in both hemispheres coincidentally with the onset of the MY 35 perihelion dust season. We present the temporal evolution of the vertical distribution of HCl (0.1–6 ppbv) and of dust activity in both hemispheres. We also report two observations of > 2 ppbv HCl below 10 km in the northern hemisphere during the aphelion period.
More details from the publisher
Details from ORA
More details

Transient HCl in the atmosphere of Mars

Science Advances American Association for the Advancement of Science 7:7 (2021) eabe4386

Authors:

Oleg Korablev, Kevin S Olsen, Alexander Trokhimovskiy, Franck Lefèvre, Franck Montmessin, Anna A Fedorova, Michael J Toplis, Juan Alday, Denis A Belyaev, Andrey Patrakeev, Nikolay I Ignatiev, Alexey V Shakun, Alexey V Grigoriev, Lucio Baggio, Irbah Abdenour, Gaetan Lacombe, Yury S Ivanov, Shohei Aoki, Ian R Thomas, Frank Daerden, Bojan Ristic, Justin T Erwin, Manish Patel, Giancarlo Bellucci, Jose-Juan Lopez-Moreno, Ann C Vandaele

Abstract:

A major quest in Mars' exploration has been the hunt for atmospheric gases, potentially unveiling ongoing activity of geophysical or biological origin. Here, we report the first detection of a halogen gas, HCl, which could, in theory, originate from contemporary volcanic degassing or chlorine released from gas-solid reactions. Our detections made at ~3.2 to 3.8 μm with the Atmospheric Chemistry Suite and confirmed with Nadir and Occultation for Mars Discovery instruments onboard the ExoMars Trace Gas Orbiter, reveal widely distributed HCl in the 1- to 4-ppbv range, 20 times greater than previously reported upper limits. HCl increased during the 2018 global dust storm and declined soon after its end, pointing to the exchange between the dust and the atmosphere. Understanding the origin and variability of HCl shall constitute a major advance in our appraisal of martian geo- and photochemistry.
More details from the publisher
Details from ORA
More details
More details

Modelling interactions with ice to understand the seasonal variation of HCl

(2026)

Authors:

Bethan Gregory, Kevin Olsen, Ehouarn Millour, Megan Brown, Kylash Rajendran, Paul Streeter, Manish Patel, Franck Lefèvre

Abstract:

Despite constituting a tiny fraction of the Mars atmosphere, trace gases can play an important role in controlling atmospheric chemical cycling. However, some discrepancies between observed distributions of trace gases and modelled values indicate that there are ongoing processes in Mars’ atmosphere that are not fully understood.Hydrogen chloride (HCl) was the first new gas detected by the ExoMars Trace Gas Orbiter (TGO)[1,2], with observations from the Atmospheric Chemistry Suite (ACS) and Nadir and Occultation for Mars Discovery (NOMAD) instruments showing a strong seasonal variation over the last several Mars years. With a few exceptions, detections almost exclusively occur during the second half of the year (at solar longitudes between 180° and 360°). This is during southern hemisphere spring and summer, when temperatures, atmospheric dust content, and water vapour concentrations are higher, and ozone concentrations are low. Previous modelling has shown that heterogeneous chemical reactions involving dust or ice aerosols play a key role in controlling this seasonal pattern[3,4,5,6].Here we use the Mars Planetary Climate Model[7,8], a 3-D global circulation model with photochemistry, to investigate some potential sources and sinks of HCl in the Martian atmosphere, which could account for the seasonal variation in measurements and the observed correlations and anticorrelations with other atmospheric factors. Firstly, we examine the indirect effect of heterogeneous chemistry of OH and HO2 interacting with ice. We compare the effect of two different heterogeneous chemical schemes[9,10] on HCl distributions via their effect on other oxidative species such as O and O3. Secondly, we investigate the isolated effects of two further heterogeneous pathways involving water ice—one HCl source and one sink. Specifically, we model the uptake of HCl onto water ice, which has been studied before, and its subsequent release back to the atmosphere during ice sublimation, which has not been included in previous models.Our preliminary results (e.g., Figure 1) show that the latter cycling could account for some of the seasonality of the HCl observations. HCl concentrations remain close to the ground during the first half of the year, and then increase at higher altitudes during the second half of the year, where they could be detected by TGO's instruments. Even without the addition of other HCl sources and sinks in the model, we expect this pattern to be repeated over multiple Mars years, reproducing at least part of the annual appearance and disappearance of HCl through the recycling of chlorine.Continuing to reconcile models and observations of the cycling of HCl and other trace gases is important for achieving a more complete understanding of atmospheric processes operating on Mars today, as well as those that have played a key role over Mars’ history.Figure 1: Preliminary model results showing seasonal distributions of HCl over more than one Mars year. Each panel shows zonally-averaged HCl volume mixing ratios with altitude and latitude, and there are 30° of solar longitude between each panel. The black contour indicates a mixing ratio of 0.5 ppbv, which is the detection limit for TGO ACS.[1] Korablev O. I. et al. (2021). Sci. Adv., 7, eabe4386. [2] Olsen K. S. et al. (2021). Astron. Astrophys., 647, A161. [3] Benne, B., et al. (2025). Astron. Astrophys., 699, A362. [4] Rajendran, K. et al. (2025). JGR: Planets 130(3), p.e2024JE008537. [5] Streeter, P. M. et al. (2025). GRL 52(6), p.e2024GL111059. [6] Taysum, B. M. et al. (2024). Astron. Astrophys., 687, A191. [7] Forget, F., et al. (1999). JGR: Planets 104, E10. [8] Lefèvre, F., et al. (2004). JGR: Planets 109, E7. [9] Brown M. A. J. et al. (2022). JGR: Planets, 127, p.e2022JE007346. [10] Lefèvre, F., et al. (2021) JGR: Planets, 126, p.e2021JE006838.
More details from the publisher

MoonTools: A Framework for Hyperspectral Data Processing and Parameter Retrieval

(2026)

Authors:

Henry Eshbaugh, Katherine Shirley, Fiona Henderson, Namrah Habib, Emma Belhadfa, Robert Spry, Kevin Olsen, Neil Bowles

Abstract:

MoonTools is a software framework, written in the Julia programming language [9], allowing straightforward, flexible, and performant processing of multispectral and hyperspectral data products. Designed originally to operate on M3 observations [4, 5], our framework is readily extensible to a wide range of datasets.Drawing from functional programming [6], our framework emphasizes composition of disparate operations. Processing pipelines are constructed in native Julia, parametrised by partial function application. This approach allows for flexibility of use and ease of extensibility, and distinguishes our work from similar tools, e.g. [7]; further, Julia’s just-in-time compilation  and parallel-programming tools allow for fast, multithreaded operations on multi-terabyte datasets, including for user-supplied inputs.Implemented operations include thermal and photometric corrections of multispectral radiance cubes, reflectance retrievals, spectral parameter determination, and post-processing amongst others. Additional utilities allow users to search datasets for targets by nomenclature, terrain type, and local solar time. Various dataset export options are available, including HDF5 products and “at a glance” views of regions of interest.We provide an example Julia pipeline in Listing 1, reproducing the detection of spinel at Theophilus crater [1,2]. We begin by importing the MoonTools package; then, we define a RATIO parameter expression. The spectral parameters SPINEL and PYROXENE are implemented as in [2] up to a constant factor using the RATIO definition. Invoked macros produce multithreaded CPU and GPU-kernel implementations of these parameters transparently to the user. Finally, a pipeline is composed: we search M3 data for observations of Theophilus crater, apply parameters, and produce “quicklook” plots of all matching observations; one such plot is shown in Figure 1.Listing 1: Pipeline invocation, including parameter definitions, required to produce Figure 1.using MoonTools@paramdef RATIO(λs, R; λ1, λ2) = sum(R[λ1]) / sum(R[λ2])@param SPINEL   RATIO [1400]       [1750]@param PYROXENE RATIO [0700, 1200] [0950]observations(:m3) > by_name("Theophilus") > PYROXENE > SPINEL > quicklookFigure 1: One of several quicklook outputs, showing Theophilus crater. Quicklooks are intended to provide overviews of regions of interest (RoIs) indicated by pipeline construction. Plots on the left include a reference narrowband reflectance, and PYROXENE and SPINEL parameter maps across the RoI. The RoI is partitioned into a 3x3 grid of zones; spectra sampled from each zone are plotted on the right in corresponding positions.Striping artifacts exist throughout the M3 dataset, and are prominent in spectral parameter products; state-of-the-art tooling must destripe these images [7,8]. We provide a bespoke destriping algorithm using a wavelet packet decomposition [3]. The modified pipeline is given in Listing 2; a destriped spinel map is shown in Figure 2.Listing 2: Pipeline altered from Listing 1; outputs are shown in Figure 2.observations(:m3) > by_name("Theophilus") > SPINEL > destripe!Figure 2: Destriped spinel parameter map. The before and after of the destriping operation are shown in the left and center plots; the removed signal is shown on the right.Software development is progressing rapidly. We anticipate a release of MoonTools to the scientific community in the coming months; MoonTools will be distributed under the terms of an open-source software license. We will welcome bug reports, feature requests, and contributions.References[1] Dhingra, D., Pieters, C.M., Boardman, J.W., Head, J.W., Isaacson, P.J. and Taylor, L.A., 2011. Compositional diversity at Theophilus Crater: Understanding the Geological Context of Mg‐Spinel-Bearing Central Peaks. Geophysical Research Letters, 38(11).[2] Pieters, C.M., Hanna, K.D., Cheek, L., Dhingra, D., Prissel, T., Jackson, C., Moriarty, D., Parman, S. and Taylor, L.A., 2014. The distribution of Mg-spinel across the Moon and constraints on crustal origin. American Mineralogist, 99(10), pp.1893-1910.[3] Mallat, S., 1999. A Wavelet Tour of Signal Processing. Elsevier.[4] Chandrayaan-1 Moon Mineralogy Mapper Science Team (2011). M3 L1B Gridded Spectral Radiance, Version 3. PDS Cartography and Imaging Sciences Node. https://doi.org/10.17189/1520248.[5] Chandrayaan-1 Moon Mineralogy Mapper Science Team (2011). L2 Gridded Spectral Reflectance (version 1) products. https://doi.org/10.17189/1520414.[6] Backus, J., 1978. Can Programming be Liberated from the von Neumann Style? A Functional Style and its Algebra of Programs. Communications of the ACM, 21(8), pp.613-641.[7] Suárez‐Valencia, J.E., Rossi, A.P., Zambon, F., Carli, C. and Nodjoumi, G., 2024. MoonIndex, an open‐source tool to generate spectral indexes for the moon from M3 data. Earth and Space Science, 11(6), p.e2023EA003464.[8] Shkuratov, Y., Surkov, Y., Ivanov, M., Korokhin, V., Kaydash, V., Videen, G., Pieters, C. and Stankevich, D., 2019. Improved Chandrayaan-1 M3 data: A northwest portion of the Aristarchus Plateau and contiguous maria. Icarus, 321, pp.34-49.[9] Bezanson, J., Karpinski, S., Shah, V.B. and Edelman, A., 2012. Julia: A Fast, Dynamic Language for Technical Computing. arXiv preprint arXiv:1209.5145.
More details from the publisher

Pagination

  • Current page 1
  • Page 2
  • Page 3
  • Page 4
  • Page 5
  • Page 6
  • Page 7
  • Page 8
  • Page 9
  • …
  • Next page Next
  • Last page Last

Footer Menu

  • Contact us
  • Giving to the Dept of Physics
  • Work with us
  • Media

User account menu

  • Log in

Follow us

FIND US

Clarendon Laboratory,

Parks Road,

Oxford,

OX1 3PU

CONTACT US

Tel: +44(0)1865272200

University of Oxfrod logo Department Of Physics text logo
IOP Juno Champion logo Athena Swan Silver Award logo

© University of Oxford - Department of Physics

Cookies | Privacy policy | Accessibility statement

Built by: Versantus

  • Home
  • Research
  • Study
  • Engage
  • Our people
  • News & Comment
  • Events
  • Our facilities & services
  • About us
  • Giving to Physics
  • Current students
  • Staff intranet