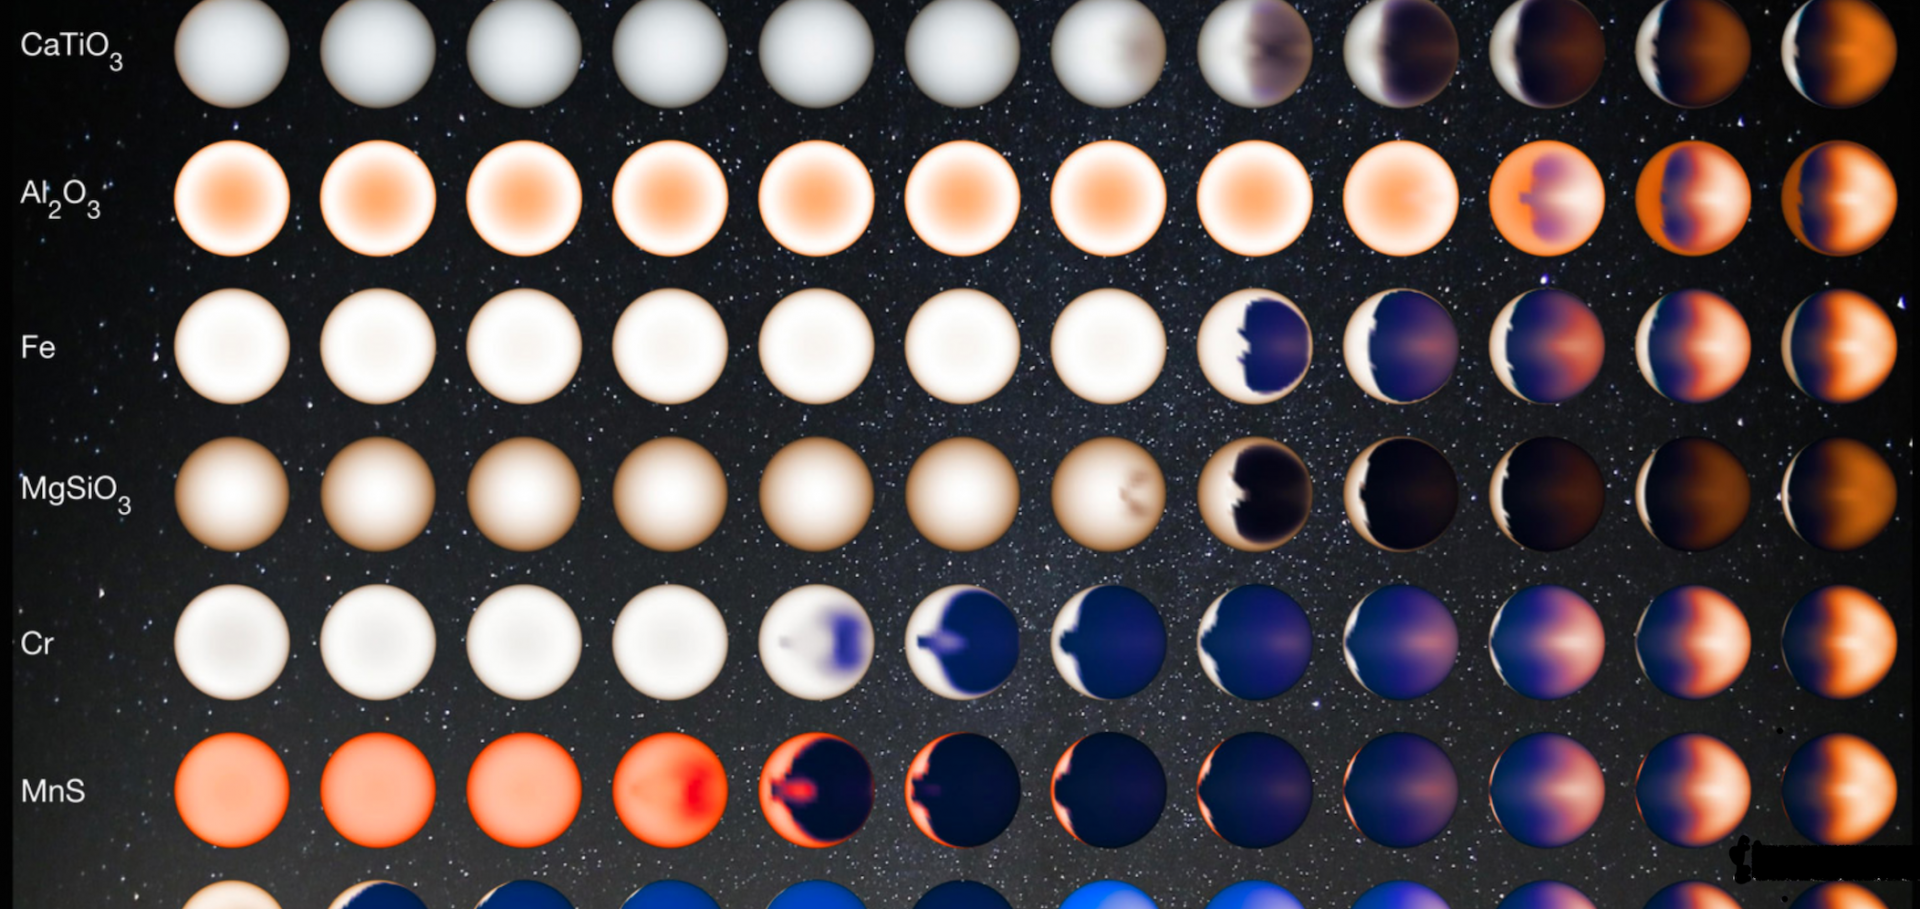
The meridional phosphine distribution in Saturn's upper troposphere from Cassini/CIRS observations

Icarus 188:1 (2007) 72-88

Authors:

LN Fletcher, PGJ Irwin, NA Teanby, GS Orton, PD Parrish, SB Calcutt, N Bowles, R de Kok, C Howett, FW Taylor

Abstract:

The Cassini Composite Infrared Spectrometer (CIRS) has been used to derive the vertical and meridional variation of temperature and phosphine (PH3) abundance in Saturn's upper troposphere. PH3 has a significant effect on the measured radiances in the thermal infrared and between May 2004 and September 2005 CIRS recorded thousands of spectra in both the far (10-600 cm-1) and mid (600-1400 cm-1) infrared, at a variety of latitudes covering the southern hemisphere. Low spectral resolution (15 cm-1) data has been used to constrain the temperature structure of the troposphere between 100 and 500 mbar. The vertical distributions of phosphine and ammonia were retrieved from far-infrared spectra at the highest spectral resolution (0.5 cm-1), and lower resolution (2.5 cm-1) mid-infrared data were used to map the meridional variation in the abundance of phosphine in the 250-500 mbar range. Temperature variations at the 250 mbar level are shown to occur on the same scale as the prograde and retrograde jets in Saturn's atmosphere [Porco, C.C., and 34 colleagues, 2005. Science 307, 1243-1247]. The PH3 abundance at 250 mbar is found to be enhanced at the equator when compared with mid-latitudes. At mid latitudes we see anti-correlation between temperature and PH3 abundance at 250 mbar, phosphine being enhanced at 45° S and depleted at 25 and 55° S. The vertical distribution is markedly different polewards of 60-65° S, with depleted PH3 at 500 mbar but a slower decline in abundance with altitude when compared with the mid-latitudes. This variation is similar to the variations of cloud and aerosol parameters observed in the visible and near infrared, and may indicate the subsidence of tropospheric air at polar latitudes, coupled with a diminished sunlight penetration depth reducing the rate of PH3 photolysis in the polar region. © 2006 Elsevier Inc. All rights reserved.

Vertical abundance profiles of hydrocarbons in Titan's atmosphere at 15° S and 80° N retrieved from Cassini/CIRS spectra

Icarus 188:1 (2007) 120-138

Authors:

S Vinatier, B Bézard, T Fouchet, NA Teanby, R de Kok, PGJ Irwin, BJ Conrath, CA Nixon, PN Romani, FM Flasar, A Coustenis

Abstract:

Limb spectra recorded by the Composite InfraRed Spectrometer (CIRS) on Cassini provide information on abundance vertical profiles of C2H2, C2H4, C2H6, CH3C2H, C3H8, C4H2, C6H6 and HCN, along with the temperature profiles in Titan's atmosphere. We analyzed two sets of spectra, one at 15° S (Tb flyby) and the other one at 80° N (T3 flyby). The spectral range 600-1400 cm-1, recorded at a resolution of 0.5 cm-1, was used to determine molecular abundances and temperatures in the stratosphere in the altitude range 100-460 km for Tb and 170-495 km for T3. Both temperature profiles show a well defined stratopause, at around 310 km (0.07 mbar) and 183 K at 13° S, and 380 km (0.01 mbar) with 207 K at 80° N. Near the north pole, stratospheric temperatures are colder and mesospheric temperatures are warmer than near the equator. C2H2, C2H6, C3H8 and HCN display vertical mixing ratio profiles that increase with height at 15° S and 80° N, consistent with their formation in the upper atmosphere, diffusion downwards and condensation in the lower stratosphere, as expected from photochemical models. The CH3C2H and C4H2 mixing ratios also increase with height at 15° S. But near the north pole, their profiles present an unexpected minimum around 300 km, observed for the first time thanks to the high vertical resolution of the CIRS limb data. C2H4 is the only molecule having a vertical abundance profile that decreases with height at 15° S. At 80° N, it also displays a minimum of its mixing ratio around the 0.1-mbar level. For C6H6, an upper limit of 1.1 ppb (in the 0.3-10 mbar range) is derived at 15° S, whereas a constant mixing ratio profile of 3-1.5+3   ppb is inferred near the north pole. At 15° S, the vertical profile of HCN exhibits a steeper gradient than other molecules, which suggests that a sink for this molecule exists in the stratosphere, possibly due to haze formation. All molecules display a more or less pronounced enrichment towards the north pole, probably due, in part, to subsidence of air at the north (winter) pole that brings air enriched in photochemical compounds from the upper atmosphere to lower levels. © 2006 Elsevier Inc. All rights reserved.

The meridional phosphine distribution in Saturn's upper troposphere from Cassini/CIRS observations

Icarus 188 (2007) 72-88

Authors:

NE Bowles, L N Fletcher, N A Teanby, P G J Irwin

New Photometry and Spectra of AB Doradus C: An Accurate Mass Determination of a Young Low-Mass Object with Theoretical Evolutionary Tracks

ArXiv astro-ph/0703564 (2007)

Authors:

Laird M Close, Niranjan Thatte, Eric L Nielsen, Roberto Abuter, Fraser Clarke, Matthias Tecza

Abstract:

We present new photometric and spectroscopic measurements for the unique, young, low-mass evolutionary track calibrator AB Dor C. While the new Ks photometry is similar to that previously published in Close et al. (2005) the spectral type is found to be earlier. Based on new H & K IFS spectra of AB Dor C (Thatte et al. 2007; paper 1) we adopt a spectral type of M5.5+/-1.0 for AB Dor C. This is considerably earlier than the M8+/-1 estimated in Close et al. (2005) and Nielsen et al. (2005) yet is consistent with the M6+/-1 independently derived by Luhman & Potter (2005). However, the spectrum presented in paper 1 and analyzed here is a significant improvement over any previous spectrum of AB Dor C. We also present new astrometry for the system which further supports a 0.090+/-0.005 Msun mass for the system. Once armed with an accurate spectrum and Ks flux we find L=0.0021+/-0.0005 Lsun and Teff=2925{+170}{-145}K for AB Dor C. These values are consistent with a ~75 Myr 0.090+/-0.005 Msun object like AB Dor C according to the DUSTY evolutionary tracks (Chabrier et al. 2000). Hence masses can be estimated from the HR diagram with the DUSTY tracks for young low-mass objects like AB Dor C. However, we cautiously note that underestimates of the mass from the tracks can occur if one lacks a proper (continuum preserved) spectra or is relying on NIR fluxes alone.

Intense star formation and feedback at high redshift: Spatially resolved properties of the z = 2.6 submillimeter galaxy SMM J14011+02521

Astrophysical Journal 657:2 I (2007) 725-737

Authors:

NPH Nesvadba, MD Lehnert, R Genzel, F Eisenhauer, AJ Baker, S Seitz, R Davies, D Lutz, L Tacconi, M Tecza, R Bender, R Abuter

Abstract:

We present a detailed analysis of the spatially resolved properties of the lensed submillimeter galaxy (SMG) SMM J14011+0252 atz = 2.56, combining deep near-infrared integral-field data obtained with SPIFFI on the VLT with other multiwavelength data sets. As previously discussed by other authors, the broad characteristics of SMM J14011+0252 in particular and submillimeter galaxies in general are in agreement with what is expected for the early evolution of local massive spheroidal galaxies. From continuum and line flux, velocity, and dispersion maps, we measure the kinematics, star formation rates, gas densities, and extinction for individual subcomponents. The star formation intensity is similar to low-redshift "maximal starbursts," while the line fluxes and the dynamics of the emission line gas provide direct evidence for a starburst-driven wind with physical properties very similar to local superwinds. We also find circumstantial evidence for "self-regulated" star formation within J1. The relative velocity of the bluer companion J2 yields a dynamical mass estimate for J1 within ∼20 kpc of Mdyn ∼ 1 × 10¹¹ M⊙. The relative metallicity of J2 is 0.4 dex lower than in J1n/J1s, suggesting different star formation histories. Spectral energy distribution fitting of the continuum peak J1c confirms and substantiates previous suggestions that this component is a z = 0.25 interloper. When removing J1c, the stellar continuum and Hα line emission appear well aligned spatially in two individual components, J1n and J1s, and coincide with two kinematically distinct regions in the velocity map, which might well indicate a merging system. This highlights the close similarity between SMGs and ultraluminous infrared galaxies (ULIRGs), which are often mergerdriven maximal starbursts, and suggests that the intrinsic mechanisms of star formation and related feedback are in fact similar to low-redshift strongly star-forming systems. © 2007. The American Astronomical Society. All rights reserved.