A simple carbon cycle representation for economic and policy analyses
Climatic Change Springer Nature 126:3-4 (2014) 319-335
HCN ice in Titan’s high-altitude southern polar cloud
Nature Springer Nature 514:7520 (2014) 65-67
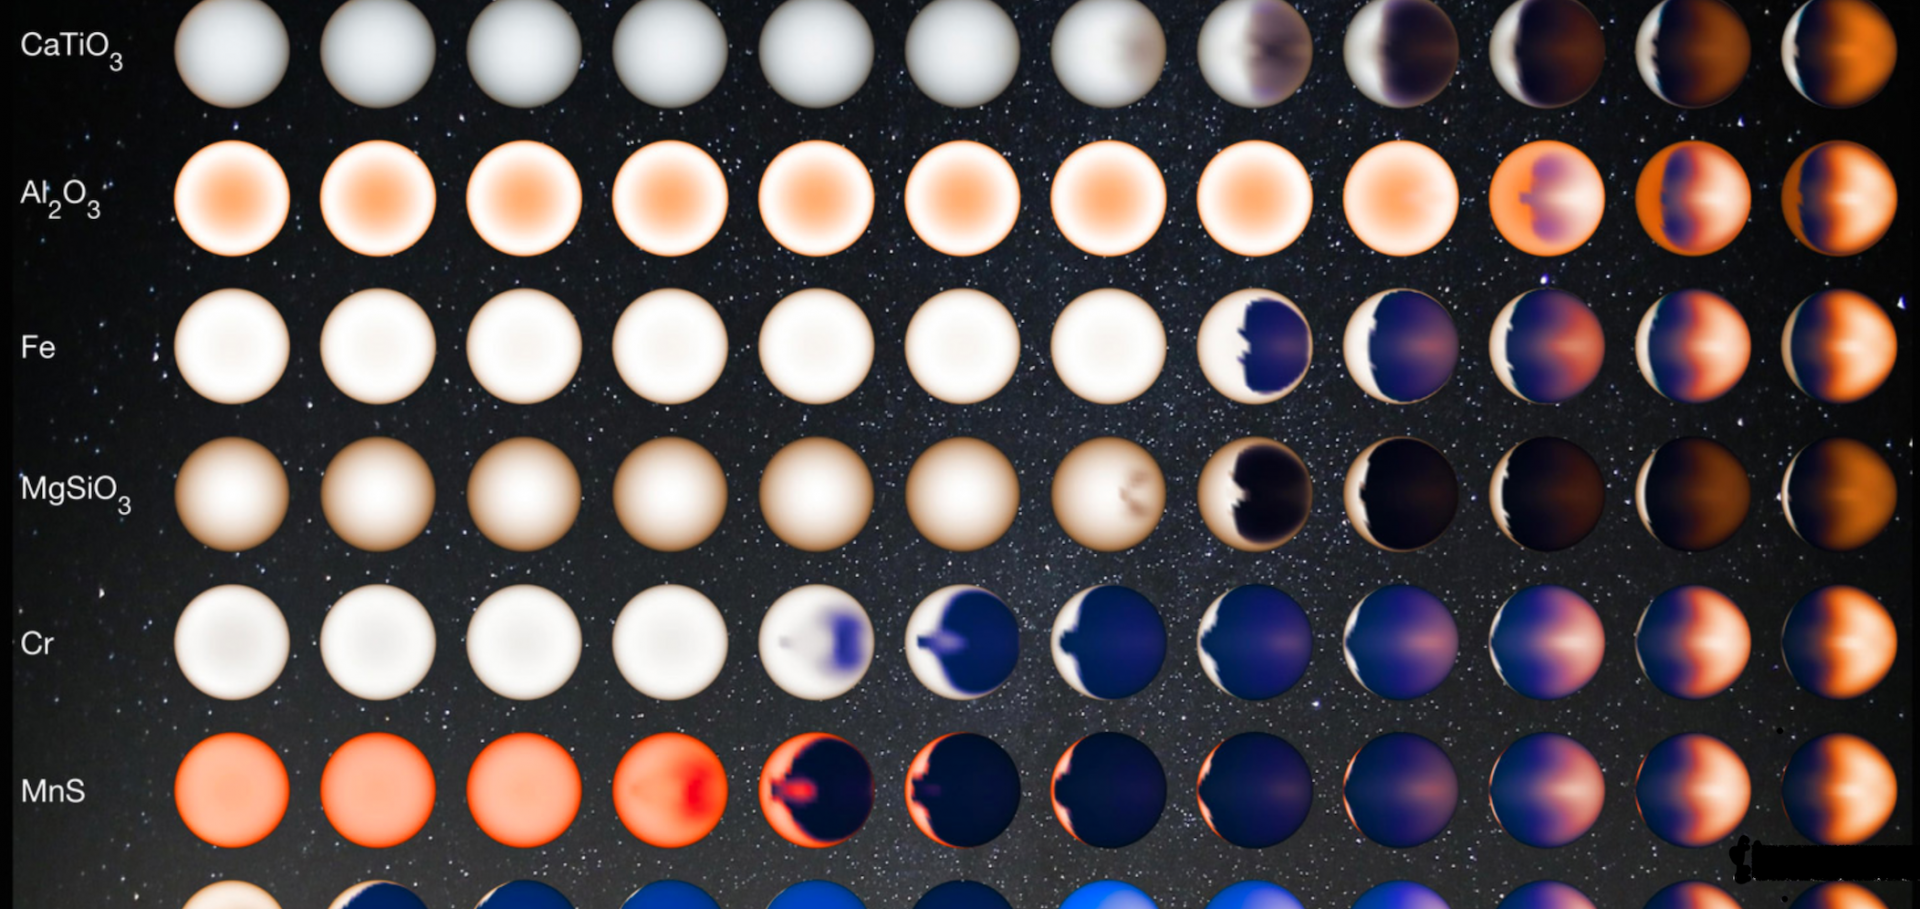
Magnetic Effects in Hot Jupiter Atmospheres
(2014)
ALMA measurements of the HNC and HC$_3$N distributions in Titan's atmosphere
(2014)