Home
Department Of Physics text logo
  • Research
    • Our research
    • Our research groups
    • Our research in action
    • Research funding support
    • Summer internships for undergraduates
  • Study
    • Undergraduates
    • Postgraduates
  • Engage
    • For alumni
    • For business
    • For schools
    • For the public
Menu
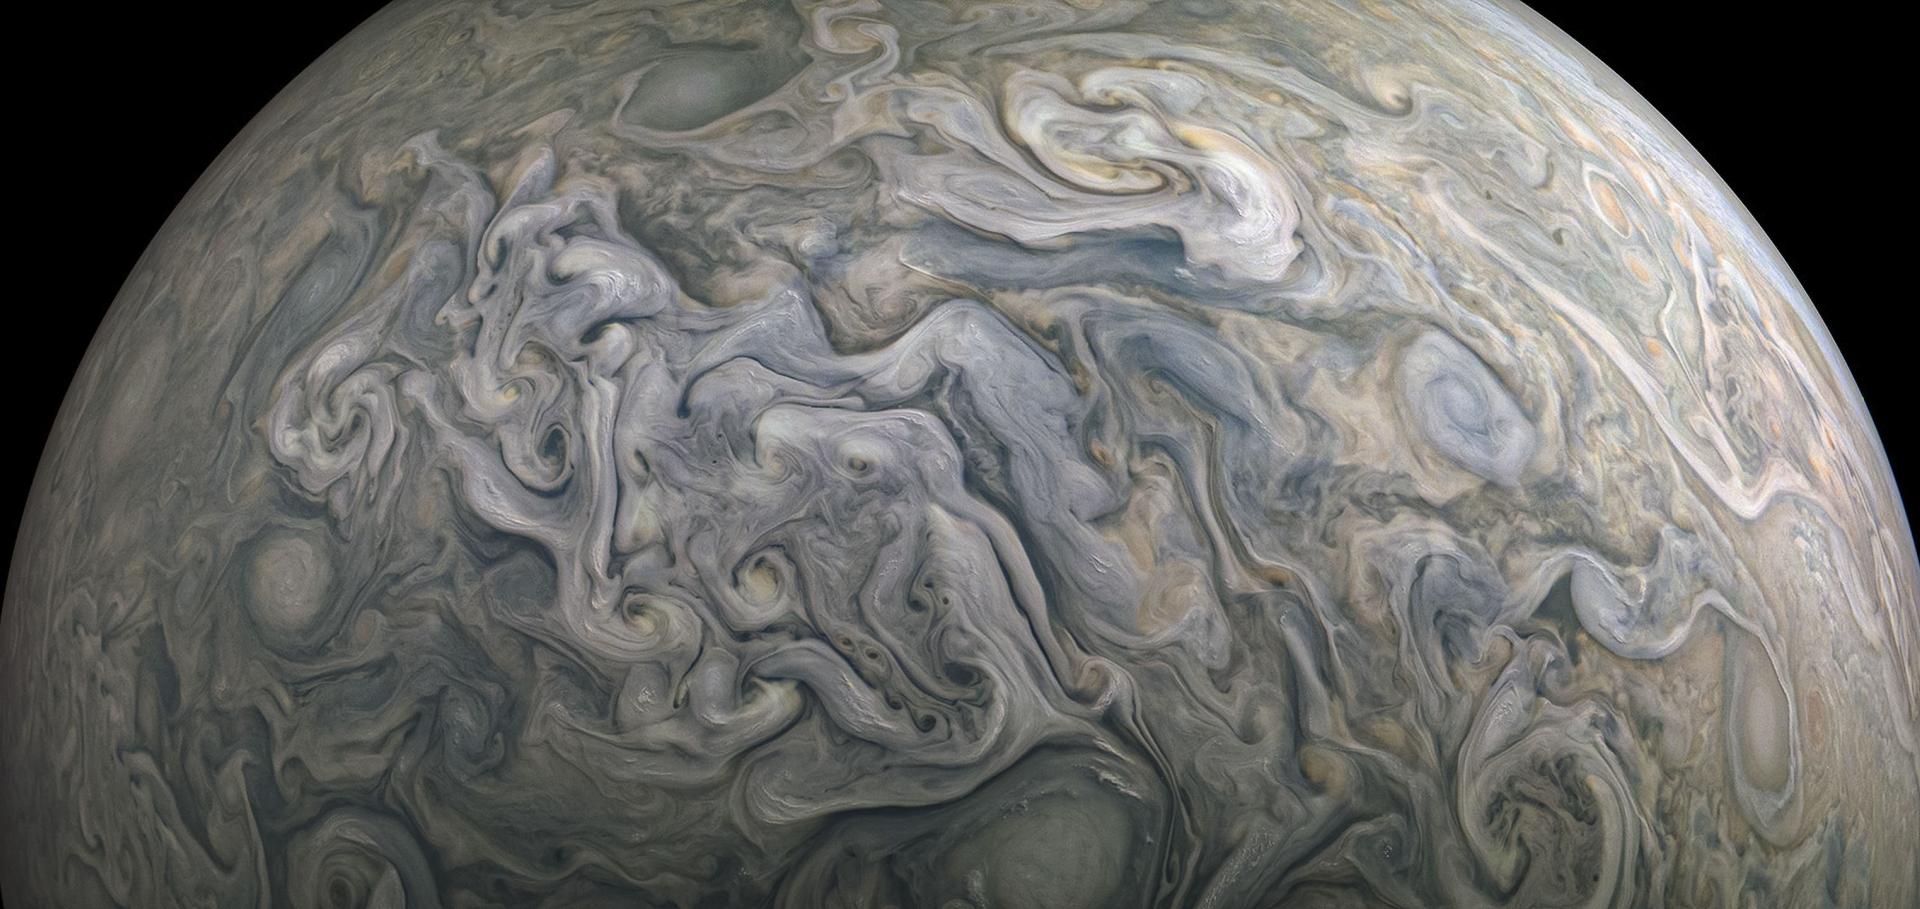
Juno Jupiter image

Prof. Patrick Irwin

Professor of Planetary Physics

Research theme

  • Exoplanets and planetary physics

Sub department

  • Atmospheric, Oceanic and Planetary Physics

Research groups

  • Exoplanet atmospheres
  • Planetary atmosphere observation analysis
  • Solar system
patrick.irwin@physics.ox.ac.uk
Telephone: 01865 (2)72083
Atmospheric Physics Clarendon Laboratory, room 306
Personal research page
NEMESIS
  • About
  • Publications

Microphysical Modeling of Hydrogen Sulfide Clouds in the Atmospheres of the Ice Giants

(2025)

Authors:

Daniel Toledo, Pascal Rannou, Patrick Irwin, Bruno de Batz de Trenquelléon, Michael Roman, Noé Clément, Gwenael Milcareck, Victor Apestigue, Ignacio Arruego, Margarita Yela

Abstract:

Radiative transfer analyses of spectra obtained from Uranus and Neptune have revealed the presence ofa cloud layer at pressures greater than ~2 bar (1,2). The detection of hydrogen sulfide (H₂S) gas abovethis cloud layer on both planets (3,4) suggests that H₂S ice is the most likely main constituent. Thisinterpretation is further supported by the expectation that methane (CH₄) clouds condense at higheraltitudes (5). However, due to their depth and observational limitations, our understanding of theproperties of H₂S clouds on these planets remains very limited.To investigate the properties of H₂S clouds in the atmospheres of Uranus and Neptune, we employed aone-dimensional cloud microphysics model originally developed for Titan and Mars (6,7). The modelincludes nucleation, condensation, evaporation, coagulation, and precipitation processes, and haspreviously been used to simulate haze and CH₄ cloud microphysics in the Ice Giants (5,8,9).Figure 1 shows, as an example, simulated H₂S ice profiles for Uranus using this microphysical model.The vertical transport of H₂S gas is simulated using an eddy diffusion coefficient (Keddʏ), which controlsthe supply of vapor for cloud nucleation and particle growth. We employed the Keddʏ profiles derivedin [10] for H₂S abundances of 10× and 30× solar. Since several cloud microphysical parameters for H₂Sremain uncertain (e.g., the contact parameter), different values are tested in the simulations. In theexample shown, the model indicates cloud bases near 5.3 bar for 10× solar abundance and 6.4 bar for30× solar. Near the cloud base, particle mean radii range from 40 to 55 μm, depending on the assumedcontact parameter and abundance. At higher altitudes, particle sizes decrease; for instance, at ~3 bar,mean radii are around 20 μm. In general, H₂S cloud simulations produce higher opacities than CH₄clouds.In this work, we will present a series of cloud microphysical simulations of H₂S clouds in the Ice Giants.Various cloud properties, such as particle size distributions and precipitation rates, will be constrained.We will also discuss the implications of our results for the atmospheric circulation of these planets andfor the future exploration of Uranus.Figure 1. Vertical distributions of H2S ice (g/m³) for Uranus, simulated for different values of the cloudcontact parameter and deep H2S abundances. These simulations employ the Keddʏ profiles calculated in[10] for the corresponding H2S abundances.References: [1] P. G. Irwin, et al., JGR: Planets, 127, e2022JE007189. [2] L. Sromovsky, et al., Icarus,Volume 317, (2019) [3] P. G. Irwin, et al., Nature Astronomy 2, 420 (2018). [4] P. G. Irwin, et al.,Icarus 321, 550 (2019). [5] D. Toledo, et al., A&A, 694, A81 (2025). [6] P. Rannou, et al., Science 311,201 (2006). [7] F. Montmessin, et al., JGR: Planets 107, 4 (2002). [8] D. Toledo, et al., Icarus, 333, 1-11, (2019). [9] D. Toledo, et al., Icarus, Volume 350, (2020). [10] H. Ge, et al., The Planetary ScienceJournal,5, 101(2024). 
More details from the publisher

Neptune's Latitudinal H2S Distribution: Reconciling Near-Infrared and Microwave Observations

Copernicus Publications (2025)

Authors:

Joseph Penn, Patrick Irwin, Jack Dobinson

Abstract:

In 2018, analysis of Gemini-NIFS near-infrared observations revealed the probable presence of H2S above the main cloud deck on Neptune [1]. The spectral signature of the gas was found to be much stronger at Neptune's south pole compared to regions nearer the equator.Conversely, analysis of Neptune's microwave emission with ALMA suggested strongly enhanced H2S abundances at midlatitudes [2], with much less at the south pole. Determining the true variation of H2S with latitude is crucial for understanding the tropospheric circulation of Neptune.We present our analysis of observations of Neptune from VLT-SINFONI in 2018. Using a limb-darkening approximation, we are able to fit the reflected solar radiance from multiple zenith angles, which allows us to discriminate between gas and aerosol opacity. Despite the lower spectral resolution of this instrument compared to Gemini-NIFS, we are able to detect the H2S spectral signature. With our radiative transfer retrieval code, archNEMESIS [3], we use nested sampling to fit a parameterised cloud model (similar to that of [4]) to these observations over a range of latitudes. We prescribe a latitudinally varying deep methane abundance derived from recent VLT-MUSE observations [5], which enables us to constrain the depth of the cloud top.Our retrieved results are in agreement with the results derived from ALMA [2] - we find a significant enhancement of deep H2S at Neptune's southern midlatitudes, decreasing towards the equator and the pole. Our results show a much deeper cloud top towards the pole, resulting in the increased cloud top column abundance of H2S observed here in the previous near-infrared analysis [1].Figure 1: A comparison of fits to a spectrum extracted from the 50°S to 60°S latitude band, with a model including H2S (blue) and a model without H2S (red). Note the significant discrepancy around 1.58 microns. The models are fitted to spectra at two zenith angles simultaneously.[1] Irwin, P. G., Toledo, D., Garland, R., Teanby, N. A., Fletcher, L. N., Orton, G. S., & Bézard, B. (2019). Probable detection of hydrogen sulphide (H2S) in Neptune’s atmosphere. Icarus, 321, 550-563.[2] Tollefson, J., de Pater, I., Luszcz-Cook, S., & DeBoer, D. (2019). Neptune's latitudinal variations as viewed with ALMA. The Astronomical Journal, 157(6), 251.[3] Alday, J., Penn, J., Irwin, P. G., Mason, J. P., & Yang, J. (2025). archNEMESIS: an open-source Python package for analysis of planetary atmospheric spectra. arXiv preprint arXiv:2501.16452.[4] Irwin, P. G., Teanby, N. A., Fletcher, L. N., Toledo, D., Orton, G. S., Wong, M. H., ... & Dobinson, J. (2022). Hazy blue worlds: a holistic aerosol model for Uranus and Neptune, including dark spots. Journal of Geophysical Research: Planets, 127(6), e2022JE007189.[5] Irwin, P. G., Dobinson, J., James, A., Wong, M. H., Fletcher, L. N., Roman, M. T., ... & de Pater, I. (2023). Latitudinal variations in methane abundance, aerosol opacity and aerosol scattering efficiency in Neptune's atmosphere determined from VLT/MUSE. Journal of Geophysical Research: Planets, 128(11), e2023JE007980.
More details from the publisher

Optically Observed Ammonia in the Northern Equatorial Zone

(2025)

Authors:

Steven M Hill, Patrick Irwin, John Rogers, Leigh Fletcher

Abstract:

IntroductionJupiter’s northern Equatorial Zone (EZn) and southern North Equatorial Belt (NEBs) are dominated by three features: five-micron hotspots (seen as North Equatorial Dark Features, NEDFs, in the optical), white cloud plumes, and complex local circulation. These features are influenced by the NEBs jet, which is modulated by a meridionally trapped Rossby wave, in conjunction with the high concentration of ammonia in the EZ and the ammonia depletion in the NEB. Numerous measurements have been made of the temperature, aerosol, and ammonia distributions in this region (c.f. Fletcher et al., 2020). And a number of models have been partially successful at explaining the interrelationships between the observed features (c.f Showman & Dowling, 2000). Here we explore the ammonia and cloud height distribution during 2024-25, when NEDFs and five-micron hotspots were prominent, using the optical band-average technique (Hill et al., 2024, Irwin et al., 2025). We show that while many sensing methods highlight the ammonia and aerosol depletion in five-micron hotspots, this band average method highlights enhancements in ammonia to the south of the hotspots.ObservationsMultiple observations on 2025-01-06 were made allowing coverage of a wide range of longitudes and coverage of a given longitude at several zenith angles. Figure 1 shows maps constructed using the method of Hill et al. (2024). An empirical limb correction is applied in addition to a weighted averaging scheme for overlapping observations. The data clearly show that enhanced ammonia regions lie to the south of NEDFs (labeled 1-4 in order of ascending longitude). For the ammonia enhancements we observe a planetary wave number of nine, within the range of hotspot and NEDF wavenumbers typically observed.DiscussionThe NEBs jet speed peaks at about  7° N, which in fact marks the boundary between the NEDFs and the ammonia enhancements. Anticyclonic gyres are a known feature seen in the same location as we show ammonia enhancements (c.f. Choi et al., 2013). We hypothesize that these gyres are regions of uplift and outflow, bringing up ammonia rich air from deeper levels of the atmosphere. The NEDFs are thought to be areas of subsidence, with cyclonic flow, where dryer air descends from above and results in a clearing of aerosols. Figure 1D shows this schematically with upwelling occurring at the gyres, horizontal winds carrying condensates from the upwelling source to the east and northeast as the visible cloud plumes, and descending clear air in the NEDFs.To further support this hypothesis, we analyze the ammonia mole fraction and cloud pressure at the NEDFs, gyres, and in the plumes through a regions-of-interest (ROI) approach. Figure 2 shows a longitudinal subset of the data in Figure 1, focusing on ammonia regions 3 and 4. Rectangles outline the ROIs which are analyzed for three observation times in Figure 2A. Figure 2B shows a time series of average values at each observation time for cloud pressure and ammonia mole fraction along with statistical errors. Finally, 2C shows scatter plots of the average cloud pressure versus the ammonia abundance. Note the very clear clustering of points where the NEB sample provides a consistent reference with relatively high pressure and very low ammonia abundance. Following the upwelling ammonia, eastward advection of plume aerosols, and NEDF subsidence from Figure 1, we can trace an ammonia cycle between its gaseous source and sink, with an intermediary aerosol state.Future WorkHundreds of observations of NEDFs and ammonia enhancements in the EZn have been made in 2024-25 using the Hill et al. (2024) technique. This data set will be analyzed and assessed for the statistical consistency of the results presented here. In addition, this data set will be compared to complementary multispectral observations to help discriminate why the optical method seems to so clearly detect ammonia enhancements at the 1-2 bar pressure level and why these enhancements appear broad enough to overlap NEDFs.Figure 1. Ammonia mole fraction, cloud pressure, and visual context maps created from observations on 2025-01-06 using an 11 inch Schmidt-Cassegrain telescope. A) Ammonia mole fraction (ppm) with enhanced areas labeled 1-4 in order of ascending longitude. The black circle at left shows the approximate spatial resolution of the data. B) Cloud pressure (mbar). C) Visual context image with selected contour overlays to show enhanced ammonia mole fraction and lowest pressure (highest) clouds. D) Same as C), but with arrows indicating presumed upwelling (black ⊙), downwelling (white ⦻), and horizontal flow (red arrows). Figure 2. Two ammonia enhancements (4 & 3 from Figure 1), associated plumes, and NEDFs are analyzed for cloud pressure and ammonia abundance. Three observations are assessed with the targets near nadir viewing. A) Ammonia mole fraction, cloud pressure, and visual context image with overlaid rectangles indicating regions-of-interest (ROIs). B) Time series of cloud pressure (left) and ammonia mole fraction (right) over the three observations. C) Scatter plot of all ammonia and cloud measurements in each ROI (left) and of the averages over the three observations. Note that the NEB data are provided as a stable reference.ReferencesChoi, D. S. et al. 2013. Icarus, 223, 832. Hill, S. M. et al. 2024. Earth and Space Science, 11(8), e2024EA003562.Fletcher, L. N. et al. 2020. Journal of Geophysical Research (Planets), 125, e06399. Irwin, P. G. J. et al. 2025. Journal of Geophysical Research: Planets, 130(1), e2024JE008622. Showman, A. P., & Dowling, T. E. 2000. Science, 289, 1737-1740. 
More details from the publisher

Saturn’s Local and Seasonal Aerosol Variations Inferred from Cassini Combined UV, Visual, and Near-IR Observations  

(2025)

Authors:

James Sinclair, Emma Dahl, Kevin Baines, Tom Momary, Lawrence Sromovsky, Pat Fry, Patrick Irwin

Abstract:

Clouds are the manifestations of atmospheric dynamics, chemistry, thermal evolution, and orbital characteristics; thus, understanding their physical and spectral properties and their spatial and temporal variability is critical to understanding the planet as a whole.  Observations of Saturn by the Hubble Space Telescope since 1994 and by Cassini from 2004 - 2017 have spanned almost one Saturn year (29.5 Earth years).  Despite the wealth of data, a self-consistent picture of the seasonal variations in Saturn’s haze and cloud structure remain elusive. In this work, we present a radiative transfer analysis of Cassini-VIMS (Visible and Infrared Mapping Spectrometer) spectra in order to derive the vertical structure and color properties of Saturn’s clouds and their latitudinal and seasonal variability.  VIMS records spectra over visible (0.3 to 1.05 micron) and infrared (0.85 to 5.1 micron) channels at spectral resolutions of 7 and 16 nm, respectively.  After a review of the VIMS dataset, we have identified dayside spectra that capture unique cloud features in a given latitude circle at multiple emission angles, allowing for improved vertical discrimination of cloud models. Data are additionally available over multiple epochs, allowing us to analyze any seasonal evolution.  Using the NEMESIS radiative transfer code (Irwin et al., 2008, JQSRT 109, 1136-1150), we invert the VIMS spectra to derive the vertical profiles of phosphine (PH3), ammonia (NH3) and the vertical structure of 4 haze/cloud layers (using the cloud model and cloud/gas parameters shown in Figure 1).  In preliminary findings, in adopting the chromophore optical constants derived by Sromovsky et al., 2021 (Icarus 362, 114409) for a north polar cloud observed in 2016, we find we can adequately fit the spectra for a subset of clouds observed in September 2014.  At other locations/times, the chromophore optical constants derived by Sromovsly et al., 2021, need to be varied in order to fit the spectra within uncertainty, which indicates seasonal evolution of Saturn’s chromophore.  In this work, we present derived cloud properties and the optical constants of the derived chromophore as a function of latitude and season in order to shed light on the complex interplay between cloud structure, color, chemistry, and orbital characteristics.     
More details from the publisher

Temperature, Composition, and Cloud structure in Atmosphere of Neptune from MIRI-MRS and NIRSpec-IFU Observations

(2025)

Authors:

Michael Roman, Leigh Fletcher, Heidi Hammel, Oliver King, Glenn Orton, Naomi Rowe-Gurney, Patrick Irwin, Julianne Moses, Imke de Pater, Henrik Melin, Jake Harkett, Simon Toogood, Stefanie Milam

Abstract:

We present observations and analysis of Neptune’s atmosphere from JWST, providing new constraints on hydrocarbon abundances, cloud properties, and temperature structure across the planet’s disk.  JWST observed Neptune in June 2023 (program1249) as part of the Solar System Guaranteed Time Observations (GTO). Integral field spectroscopy (IFS) with the Near-Infrared Spectrograph (NIRSpec) and the Mid-Infrared Instrument/Medium Resolution Spectrometer (MIRI/MRS) were combined to provide nearly simultaneous and continuous spatial and spectral data between 1.66 and 28.70 microns.We show how wavelengths sensitive to the atmospheric temperatures reveal a structure consistent with Voyager [1] and ground-based imaging [2,3], with a sharply defined warm polar vortex. In contrast, wavelengths sensitive to stratospheric hydrocarbons (namely acetylene and ethane) show a marked enhancement in the northern winter hemisphere.Finally, we examine the distribution and vertical structure of clouds in context of the temperature and chemical structure. Scattered light in NIRSpec observations indicate variable discrete clouds extend to pressures of roughly 50 mbar at the northernmost latitudes and south pole. [1] Conrath, B. J., F. M. Flasar, and P. J. Gierasch. "Thermal structure and dynamics of Neptune's atmosphere from Voyager measurements." Journal of Geophysical Research: Space Physics 96, no. S01 (1991): 18931-18939.[2] Fletcher, Leigh N., Imke de Pater, Glenn S. Orton, Heidi B. Hammel, Michael L. Sitko, and Patrick GJ Irwin. "Neptune at summer solstice: zonal mean temperatures from ground-based observations, 2003–2007." Icarus 231 (2014): 146-167.[3] Roman, Michael T., Leigh N. Fletcher, Glenn S. Orton, Thomas K. Greathouse, Julianne I. Moses, Naomi Rowe-Gurney, Patrick GJ Irwin et al. "Subseasonal variation in Neptune’s mid-infrared emission." The Planetary Science Journal 3, no. 4 (2022): 78.
More details from the publisher

Pagination

  • First page First
  • Previous page Prev
  • Page 1
  • Page 2
  • Page 3
  • Current page 4
  • Page 5
  • Page 6
  • Page 7
  • Page 8
  • Page 9
  • …
  • Next page Next
  • Last page Last

Footer Menu

  • Contact us
  • Giving to the Dept of Physics
  • Work with us
  • Media

User account menu

  • Log in

Follow us

FIND US

Clarendon Laboratory,

Parks Road,

Oxford,

OX1 3PU

CONTACT US

Tel: +44(0)1865272200

University of Oxfrod logo Department Of Physics text logo
IOP Juno Champion logo Athena Swan Silver Award logo

© University of Oxford - Department of Physics

Cookies | Privacy policy | Accessibility statement

Built by: Versantus

  • Home
  • Research
  • Study
  • Engage
  • Our people
  • News & Comment
  • Events
  • Our facilities & services
  • About us
  • Current students
  • Staff intranet