More than meets the eye(ball) for tidally-locked habitability: dependence on atmospheric circulation regime
Copernicus Publications (2026)
Abstract:
Rocky planets hosted by M-dwarf stars represent the most abundant and accessible class of potentially habitable targets for atmospheric characterisation with current and planned observatories. Owing to the close proximity of the habitable zone around these cooler stars, such planets are expected to be tidally locked, giving rise to a set of atmospheric circulation regimes determined primarily by planetary rotation rate and incident stellar flux. Previous climate modelling studies have commonly identified a characteristic 'eyeball' habitable climate for these worlds, illustrative of the approximately circular area surrounding the sub-stellar point where surface temperatures rise above freezing. Using an ensemble of three general circulation models (ExoCAM, LFRic, and ROCKE-3D), we examine the influence of circulation regime on surface habitability across the inner edge of the M-dwarf habitable zone, simulating Earth-like aquaplanets with rotation periods spanning the ‘fast’, ‘Rhines’, and ‘slow’ regimes (4.25–44.33 days). We make use of a new metric of surface habitability which has been previously validated against past and present habitability on Earth, and extends beyond the traditionally-used 'liquid water' temperature condition to define two habitable temperature ranges for each microbial and complex life, as well as using surface water fluxes as a proxy for water and nutrient availability. This additional constraint produces spatial patterns of habitability that differ from those defined by temperature alone, whereby large areas surrounding the substellar point with habitable temperatures but negative net precipitation (P - E < 0) are now designated as ‘limited’ habitability. Furthermore, distinct spatial patterns of habitability emerge across the ensemble for each regime, indicating a dependence on the atmospheric circulation and associated transport of heat and moisture. For slower-rotators, habitable area is substantially reduced as surface moisture is largely confined to the day-side, while faster rotators show a more extensive habitable area but greater variation between the models in global habitable fraction.Redox processes of slightly-carbon-rich rocky planets
(2026)
Abstract:
A voyage of discovery: Exploring the atmospheres of solar system planets and exoplanets with NEMESIS
(2026)
Abstract:
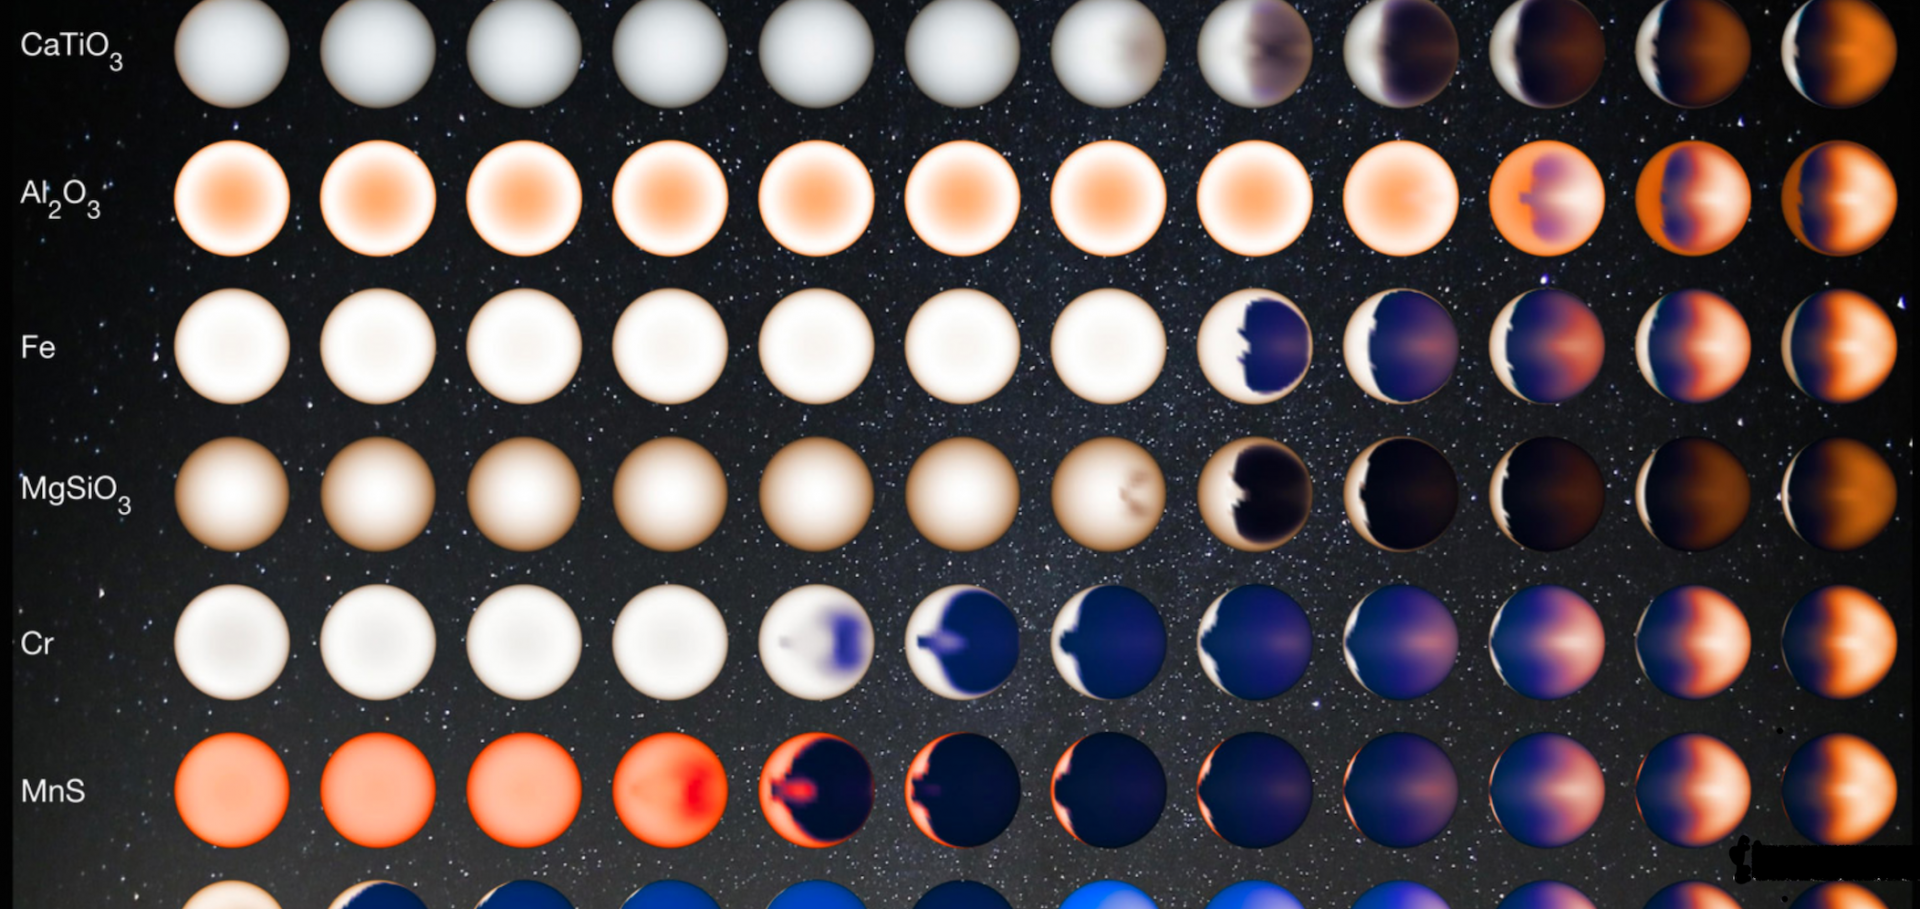
Circulation models, interior evolution, and James Webb observations of the ultra-hot Jupiter WASP-76b
Copernicus Publications (2026)
Abstract:
We present a suite of General Circulation Models (GCMs) and interior evolution models of the ultra-hot Jupiter WASP-76b using the SPARC framework of ADAM (formerly the SPARC/MITgcm) and compare the results to recently obtained JWST NIRSpec/G395H phase-curve and emission data. The emission spectra of the planet is obtained on the dayside, nightside, and morning and evening limbs.We vary a spatially independent atmospheric drag term; this crudely represents effects such as Ohmic dissipation, turbulent mixing, shocks, and hydrodynamic instabilities, suppressing the atmospheric flow within the atmosphere. We present five scenarios, varying from strong atmospheric drag to essentially drag free cases. We run models with and without the cloud species enstatite and corundum, which are allowed to circulate through the atmosphere and feed back into the radiative transfer calculations. We also account for the effect of hydrogen dissociation on the hot dayside of WASP-76b.We use a grid of MESA models to predict heating strengths required to match the present-day radius. We find which heating strengths and depths are suitable to match the present-day radius of WASP-76b and use the output temperature profiles to fix the bottom atmosphere temperature for the GCM runs. We compare the evolution and resulting profiles of models with no core, models with a simple constant density heavy-element core, and models with a self-consistent compressible core.We post-process the GCM outputs using the gCMCRT radiative transfer code. We find that the atmospheres with moderately strong drag and clouds provide the best fit to the James Webb phase-curve data. The need for strong drag aligns with results for other ultra-hot Jupiters (WASP-18b, WASP-103b, WASP-121b), from both Spitzer and JWST phase-curves.We find that our simple drag treatment doesn’t capture the complexity of the circulation around the limbs of the planet. East-west asymmetries are clear in the JWST emission data, with the morning limb being ~200 PPM ‘hotter’ than the evening limb (in units Fp/Fs). The requirement of relatively strong atmospheric drag to match the phase curve data results in near-identical simulated emission spectra in our model limbs. This motivates further research to physically motivate the mechanisms causing atmospheric drag, such as magnetohydrodynamic effects.We also vary the metallicity and C/O ratio, to better fit the emission spectra. We find that producing fits to the emission spectra requires careful consideration of the atmospheric composition.We find that interior heating has little effect on the observational properties of the planet, with the main observational effects being from the varying atmospheric drag.These results showcase the current state-of-the-art emission and phase-curve observations of WASP-76b, with comparisons to careful modelling efforts utilising a GCM with a high level of physical complexity.The Key to Unlocking Exoplanet Biosignatures: a UK-led IR Spectrograph for the Habitable Worlds Observatory Coronagraph
(2026)